Wednesday, May 21, 2014

The Art of Climate Change

by Dorsi Lynn Diaz

Help be a part of the solution! The Art of Climate Change on Kickstarter - an interactive social media & art show/exhibit this summer.

Climate change is HERE and climate change is happening NOW. It is not a figment of your imagination and the weather outside indeed is "frightening."

As I write this, the UK is getting battered by unprecedented storms and in California where I live, we are facing the possibility of a MEGA drought. As a long-time artist, writer and educator, I have been sounding the alarm bell for years. The question loomed large for me: How are we, as a collective society, going to tackle a huge problem?

That was when I had a light-bulb moment.

The idea came to me last year when I realized we need to have a multi-modal approach to addressing climate change. A hands-on, interactive dialogue with great visuals. In order to tackle the problem we needed to look at all the different aspects of climate change. And thus, the "The Art of Climate Change" was born - and the idea for a project: an art show and exhibit. But not your typical art show!

This show would be interactive and get people thinking about SOLUTIONS to climate change, challenge them to think out of the box, and most importantly, educate them about the how and wheres of climate change plus why places like the Arctic matter. This show could travel to cities and communities all over, and be a blue-print for teaching people about climate change and engage their own local artists, inventors and community in learning about "the problem."


But first I needed a venue to do the first show, and that would be one of the biggest hurdles. I connected with a local gallery, pitched the idea to them and they were impressed. In fact, they really liked my idea because it was "different" because it talked about solutions, not just doom and gloom. So now that I've been approved by their Board of Directors, I've got my venue and the show has taken on a life it its own.

The Art of Climate Change has its venue! Whoooppee!! The show is on the datebook - and it will be in run from June 19 - July 27, 2014 at The Sun Gallery in Hayward, Ca. (located in the Silicon Valley area)

I need help and support however to pull this off. This is a huge endeavor and the show has many different facets to it. I have many costs involved: Marketing, advertising, sign production, printing for the science graphics, some travel, equipment rentals (laptops and TV screens), art supplies, website hosting and building and other production costs... and this is why I am asking for your help. Not only will there be "art" on the walls but there will also be a series of artwork by children on endangered species that I have been teaching for the last several months.

The sections of the exhibit have been broken down into the following areas:

1. A section where we talk about "The Problem". This is where we talk turkey and explain the problem and take a good look at it.

2. There will be a section of the exhibit dedicated to extreme weather photos and art. Like they say, a picture can tell a thousand words, right?

3. Next we need to talk about "The Arctic and why it matters". Those record cold snaps happening in the US? Those are one of the strongest symptoms of our melting Arctic. That's due to our now meandering jet stream.

4. The Methane Monster. Yes there are monsters and this is probably one of the biggest ones we need to be worried about. Remember the dinosaur extinction? Well, scientists say that methane was their undoing. And we certainly don't want to go the way of the dinosaurs, right? So yes, we need to talk about the elephant in the room - that pesky methane monster. Which, by the way, is being released in some pretty scary amounts right now from underneath that warming Arctic water. No, it's not good. Not good at all.

5. A section just for THE CHILDREN and EDUCATION. This is the biggest reason I am doing this project. I want to be part of the solution to securing their future. One of the big parts of this project is teaching the kids. Right now I am doing a series of projects with them on endangered animal species. The way I look at it is if we can "teach the children we can touch the world." Their artwork will be prominently displayed in the art/show exhibit. So far they have done done art of endangered Polar Bear cubs, the Monarch Butterfly, Bees, Barn Owls and the Maui Dolphin.

6. A section with a "CALL TO ACTION"....this is where attendees are encouraged to engage with the problem so they can BE PART of the solution...which btw is the next big part of the art show/exhibit....

7. SOLUTIONS. This is where I have things planned that are definitely out of the box. Like inventions to slow down climate change by friends of mine that happen to be very creative too.

So that is my Kickstarter project in a very big nutshell. The really exciting thing though is how this blooming project has just sort of "vacuumed people" up...all kinds of people...from all around the world! Here are some of them that are going to be part of my project:
  • Climate Change Professor Paul Beckwith from the University of Ottawa, who will do a live Skype Q & A session with us. Attendees can sit down face to face with a leading climate change educator and ask questions about climate change from inside the show.
  • A life size mural of a Polar Bear with an Arctic scene, painted in the show/exhibit hall by muralist Lisa Hamblett-Montagnese.
  • Photographer Rose Gold will make the day even more special for kids by taking photos of them with the Polar bear.
  • A display of children and families climate change (endangered species) artwork from students of the Sun Gallery, A Joyful Noise Learning Center, Green Forest Art Studio, The Community Church of Hayward and Young Rembrandt's of the East Bay
  • A live viewing of Andy Lee Robinsons video on a flat screen TV which will be available for viewing all during the exhibits 5 1/2 weeks. Andy's video shows the decline of the Arctic ice accompanied by a musical composition by Andy called "Ice Dreams"
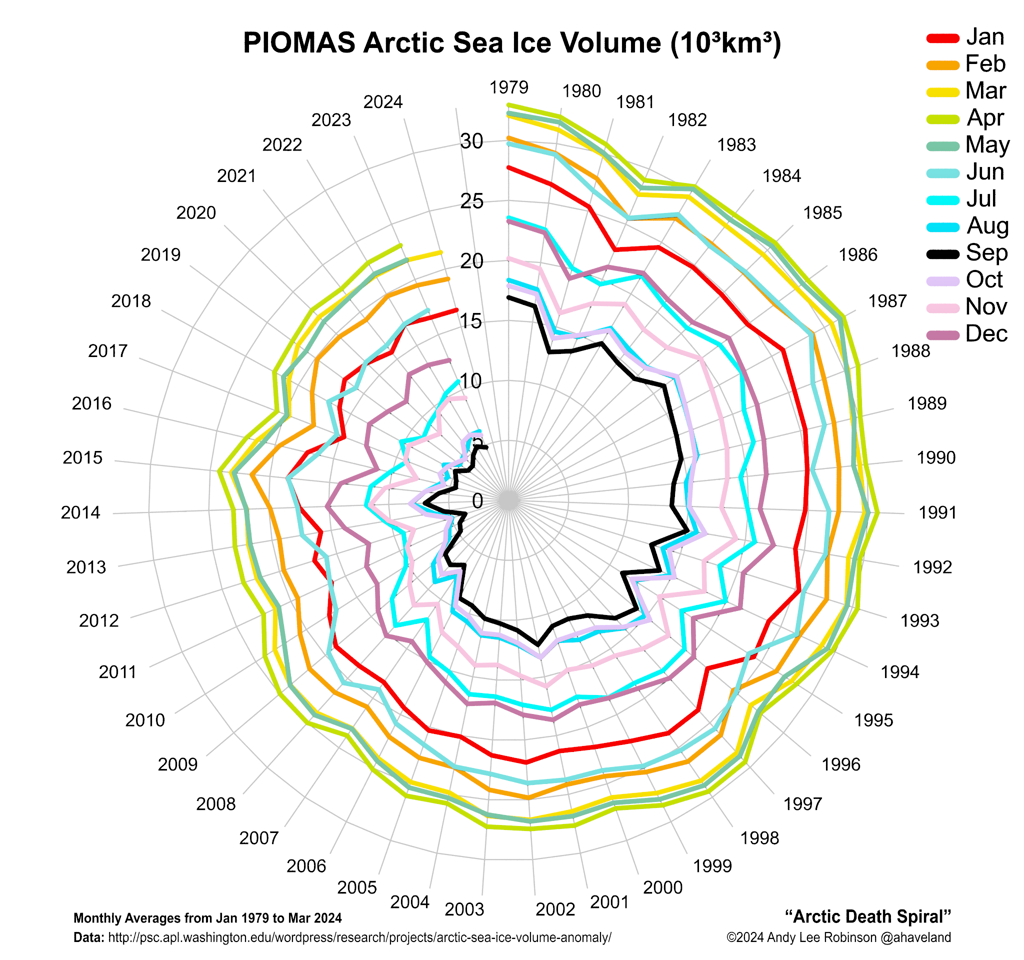
  • A graphic of "The Arctic Death Spiral" by Andy Lee Robinson, to be displayed in the Arctic section of the show.
  • A full size poster by Sam Carana (who set up the Arctic Methane Emergency Group on FB and edits the Arctic-News blog) on the effects of runaway climate change, designed by Sam and displayed in the Arctic section.
  • Original cartoons by Sam Carana, also an adviser on this project, displayed in the Methane section of the show.
  • Quotes with ideas by Harold Hensel, contributor to the Arctic-news blog and advisor on this project.
  • A full size poster of a tunnel invention as a possible solution to our warming waters by Patrick McNulty. Posted in Solutions.
  • A display of alternative fuel named "Bio-Fuel" with information by inventor Jay Toups. Posted in Solutions.
  • A live aquaponics display by Michael and Natalie Elola of Lucky Garden Hydroponics on how to grow vegetables and fruit indoors without using soil. Posted in Solutions.
  • A full size Polar bear costume mascot to be used for outreach. Designed and sewn by Nancy Martinez
  • A call for art by The Sun Gallery for extreme weather photos, climate change art and recycled and re-purposed art
  • A display of childrens books about climate change. Joe Santiago's books will also be featured. Displayed under Education.
  • The original video for the project will be displayed on a flat-screen video at the show for 5 1/2 weeks. Video editing and production by Mead Rose at Web Design by Mead.
  • Artistically designed Climate change confections by pastry chef Cori Diaz for the Artists reception
  • A local rock/punk band that sings songs about climate change. They will sing at the Artists reception.
  • Educational tables set up by the City of Hayward with information about the cities climate change plan along with other entities like the EPA, Water Conservation Board, EBMUD and Waste Management.
  • Deagon B. Williams, friend and adviser on this project.
  • Advertising help with the project by Trish McDermott of Avatar Tech Pubs.
Endangered Animal Art series taught by Dorsi Diaz


he Arctic "Death" Spiral in The Art of Climate Change
Costs for The Art of Climate Change
The many people people contributing their talents to The Art of Climate Change
The main reason I am doing the show is for them
Sam Carana's contribution to the show - a very telling graphic
The types of climate change disasters we need to talk about

This is what we need to be talking about.
Risks and challenges

I have been working on this project already for over 4 months, successfully pulling people together to either create art for the exhibit, or to contribute educational material. The biggest obstacle for the show was of course the venue but I have the venue for the art show/exhibit set in stone from June 19 - July 27 of this year. A solid foundation has been made, the main thing I need help with now is the financial expenses that the show will cost me - like the rental of equipment to do the live Skyping session with Professor Paul Beckwith, and the special art projects I plan to do within our community. I also have plans to do more community outreach to reach more local public agencies and I plan to have more events centered around the show (how much I can do will be determined by how much funding I get)

How will I deal with any special surprises or costs that I might not have possibly factored in? I will do what I always did in business, I will work with the issue and either adjust or downsize that particular part, - possibly even bartering for services, or ask for donations to help with a particular cost.

What unique challenges might I have after the project is funded? Well I don't foresee any emergencies but if there are any, I have a network of people that will help and advise me through any major problems. The only thing I see is that I may not be able to accommodate all the art that may come in, but that's a good problem to have! Better to have more than not enough - and director Liesa Lietzke and Jacqueline Cooper at The Sun Gallery where the show is will be able to help walk me through any major hiccups if there are any.

Questions?

Have a question? If the info above doesn't help, you can ask questions at Kickstarter to the project creator.

Donate

To donate to this project, go to Kickstarter.

Friday, May 16, 2014

More extreme weather can be expected


The heaviest rains and floods in 120 years have hit Serbia and Bosnia this week, Reuters and Deutsche Welle report.

The animation below shows the Jet Stream's impact on the weather. Cold temperatures have descended from the Arctic to Serbia and Bosnia in Europe and all the way down to the Gulf of Mexico in North America, while Alaska, California, and America's East Coast are hit by warm temperatures. In California, 'unprecedented' wildfires and fierce winds lead to 'firenadoes', reports CNN.


The image below shows that on May 15, 2014, the wind approaching Serbia and Bosnia at 700 hPa reached speeds of up to 120 km per hour (75 mph), as indicated by the green circle on the main image and inset.


The image below, from skeptical science, shows the cyclonic spin that can be expected in a through such as the one that hit Serbia and Bosnia recently.


As the Jet Stream changes, more extreme weather events can be expected. What makes the Jet Stream change? As the Arctic is warming up faster than the rest of the world, the temperature difference between the Arctic and the equator decreases, in turn decreasing the speed at which the Jet Stream circumnavigates the globe. This can cause 'blocking patterns', with extreme weather events hitting an area longer than before.

As the jet stream becomes wavier, cold air can more easily descend from the Arctic down to lower latitudes in a downward through of the Jet Stream, while warm air can more easily reach higher latitudes in an upward ridge of the Jet Stream.

This spells bad news for many areas across the world that can be expected to be hit by more extreme weather events such as heatwaves, wildfires fuelled by stronger winds and more intense drought, storms and floods.

Heatwaves are a huge threat in the Arctic, especially when followed by storms that can cause warm surface water to mix down to the bottom of the sea and warm up sediments under the seafloor that can contain huge amounts of methane in the form of hydrates and free gas. The situation is dire and calls for comprehensive and effective action, as discussed at the Climate Plan blog.


Related

- Extreme weather strikes around the globe - update
http://arctic-news.blogspot.com/2014/02/extreme-weather-strikes-around-the-globe-update.html

- Escalating extreme weather events to hammer humanity (by Paul Beckwith)
http://arctic-news.blogspot.com/2014/04/escalating-extreme-weather-events-to-hammer-humanity.html

- Our New Climate and Weather (by Paul Beckwith)
http://arctic-news.blogspot.com/2014/01/our-new-climate-and-weather.html

- Our New Climate and Weather - part 2 (by Paul Beckwith)
http://arctic-news.blogspot.com/2014/01/our-new-climate-and-weather-part-2.html

- Changes to Polar Vortex affect mile-deep ocean circulation patterns
http://arctic-news.blogspot.com/2012/09/changes-to-polar-vortex-affect-mile-deep-ocean-circulation-patterns.html

- Polar jet stream appears hugely deformed
http://arctic-news.blogspot.com/2012/12/polar-jet-stream-appears-hugely-deformed.html


Sunday, May 11, 2014

Changing the landscape of psychiatric research:


What will the RDoC initiative by NIMH achieve?


©CartoonStock.com


There's a lot wrong with current psychiatric classification. Every few years, the American Psychiatric Association comes up with a new set of labels and diagnostic criteria, but whereas the Diagnostic and Statistical Manual used to be seen as some kind of Bible for psychiatrists, the latest version, DSM5, has been greeted with hostility and derision. The number of diagnostic categories keeps multiplying without any commensurate increase in the evidence base to validate the categories. It has been argued that vested interests from pharmaceutical companies create pressures to medicalise normality so that everyone will sooner or later have a diagnosis (Frances, 2013). And even excluding such conflict of interest, there are concerns that such well-known categories as schizophrenia and depression lack reliability and validity (Kendell & Jablensky, 2003).


In 2013, Tom Insel, Director of the US funding agency, National Institute of Mental Health (NIMH), created a stir with a blogpost in which he criticised the DSM5 and laid out the vision of a new Research Domain Criteria (RDoC) project. This aimed "to transform diagnosis by incorporating genetics, imaging, cognitive science, and other levels of information to lay the foundation for a new classification system."


He drew parallels with physical medicine, where diagnosis is not made purely on the basis of symptoms, but also uses measures of underlying physiological function that help distinguish between conditions and indicate the most appropriate treatment. This, he argued, should be the goal of psychiatry, to go beyond presenting symptoms to underlying causes, reconceptualising disorders in terms of neural systems.


This has, of course, been a goal for many researchers for several years, but Insel expressed frustration at the lack of progress, noting that at present: "We cannot design a system based on biomarkers or cognitive performance because we lack the data". That being the case, he argued, a priority for NIMH should be to create a framework for collecting relevant data. This would entail casting aside conventional psychiatric diagnoses, working with dimensions rather than categories, and establishing links between genetic, neural and behavioural levels of description.


This represents a massive shift in research funding strategy, and some are uneasy about it. Nobody, as far as I am aware, is keen to defend the status quo, as represented by DSM.  As Insel remarked in his blogpost: "Patients with mental disorders deserve better". The issue is whether RDoC is going to make things any better. I see five big problems.


1. McLaren (2011) is among those querying the assumption that mental illnesses are 'disorders of brain circuits'. The goal of the RDoC program is to fill in a huge matrix with new research findings. The rows of the matrix are not the traditional diagnostic categories: instead they are five research domains: Negative Valence Systems, Positive Valence Systems, Cognitive Systems, Systems for Social Processes, Arousal/Regulatory Systems, each of which has subdivisions: e.g. Cognitive Systems is broken down into Attention, Perception, Working memory, Declarative memory, Language behavior and Cognitive (effortful) control. The columns of the matrix are Genes, Molecules, Cells, Circuits, Physiology, Behavior, Self-Reports, and Paradigms. Strikingly absent is anything about experience or environment.


This seems symptomatic of our age. I remember sitting through a conference presentation about a study investigating whether brain measures could predict response to cognitive behaviour therapy in depression.  OK, it's possible that they might, but what surprised me was that no measures of past life events or current social circumstances were included in the study. My intuitions may be wrong, but it would seem that these factors are likely to play a role. My impression is that some of the more successful interventions developed in recent years are based not on neurobiology or genetics, but on a detailed analysis of the phenomenology of mental illness, as illustrated, for example, by the work of my colleagues David Clark and Anke Ehlers. Consideration of such factors is strikingly absent from RDoC.


 2. The goal of the RDoC is ultimately to help patients, but the link with intervention is unclear. Suppose I become increasingly obsessed with checking electrical switches, such that I am unable to function in my job. Thanks to the RDoC program, I'm found to have a dysfunctional neural circuit. Presumably the benefit of this is that I could be given a new pharmacological intervention targeting that circuit, which will make me less obsessive. But how long will I stay on the drug? It's not given me any way to cope with the tendency of checking the unwanted thoughts that obtrude into my consciousness, and they are likely to recur when I come off it.  I'm not opposed to pharmacological interventions in principle, but they tend not to have a 'stop rule'. 


There are psychological interventions that tackle the symptoms and the cognitive processes that underlie them more directly.  Could better knowledge of neurobiological correlates help develop more of these?  I guess it is possible, but my overall sense is that this translational potential is exaggerated – just as with the current hype around 'educational neuroscience'. The RDoC program embodies a mistaken belief that neuroscientific research is inherently better than psychological research because it deals with primary causes, when in fact it cannot capture key clinical phenomena. For instance, the distinction between a compulsive hand-washer and a compulsive checker is unlikely to have a clear brain correlate, yet we need to know about the specific symptoms of the individual to help them overcome them.


3. Those proposing RDoC appear to have a naive view of the potential of genetics to inform psychiatry.  It's worth quoting in detail from their vision of the kinds of study that would be encouraged by NIMH, as stated here:


Recent studies have shown that a number of genes reported to confer risk for schizophrenia, such as DISC1 (“Disrupted in schizophrenia”) and neuregulin, actually appear to be similar in risk for unipolar and bipolar mood disorders. ... Thus, in one potential design, inclusion criteria might simply consist of all patients seen for evaluation at a psychotic disorders treatment unit. The independent variable might comprise two groups of patients: One group would be positive and the other negative for one or more risk gene configurations (SNP or CNV), with the groups matched on demographics such as age, sex, and education. Dependent variables could be responses to a set of cognitive paradigms, and clinical status on a variety of symptom measures. Analyses would be conducted to compare the pattern of differences in responses to the cognitive or emotional tasks in patients who are positive and negative for the risk configurations.


This sounds to me like a recipe for wasting a huge amount of research funding. The effect sizes of most behavioural/cognitive genetic associations are tiny and so one would need an enormous sample size to see differences related to genotype. Coupled with an open-ended search for differences between genotypes on a battery of cognitive measures, this would undoubtedly generate some 'significant' results which could go on to mislead the field for some time before a failure to replicate was achieved (cf. Munafò, & Gage, 2013).


The NIMH website notes that "the current diagnostic system is not informed by recent breakthroughs in genetics". There is good reason for that: to date, the genetic findings have been disappointing. Such associations as are found either indicate extremely rare and heterogeneous mutations of large effect and/or involve common genetic variants whose small effects are not of clinical significance. We cannot know what the future holds, but to date talk of 'breakthroughs' is misleading.


4. Some of the entries in the RDoC matrix also suggest a lack of appreciation of the difference between studying individual differences versus group effects.  The RDoC program is focused on understanding individual differences. That requires particularly stringent criteria for measures, which need to be adequately reliable, valid and sensitive to pick up differences between people.  I appreciate that the published RDoC matrices are seen as a starting-point and not as definitive, but I would recommend that more thought goes into establishing the psychometric credibility of measures before embarking on expensive studies looking for correlations between genes, brains and behaviour. If the rank ordering of a group of people on a measure is not the same from one occasion to another, or if there are substantial floor or ceiling effects, that measure is not going to be much use as an indicator of an underlying construct. Furthermore, if different versions of a task that are supposed to tap into a single construct give different patterns of results, then we need a rethink – see e.g. Foti et al, 2013; Shilling et al, 2013, for examples.  Such considerations are often ignored by those attempting to move experimental work into a translational phase. If we are really to achieve 'precision medicine' we need precise measures.


5. The matrix as it stands does not give much confidence that the RDoC approach will give clearer gene-brain-behaviour links than traditional psychiatric categories.


For instance, BDNF appears in the Gene column of the matrix for the constructs of acute threat, auditory perception, declarative memory, goal selection, and response selection. COMT appears with threat, loss, frustrative nonreward, reward learning, goal selection, response selection and reception of facial communication. Of course, it's early days. The whole purpose of the enterprise is to flesh out the matrix with more detailed and accurate information. Nevertheless, the attempts at summarising what is known to date do not inspire confidence that this goal will be achieved.


After such a list of objections to RDoC, I do have one good thing to say about it, which is that it appears to be encouraging and embracing data-sharing and open science. This will be an important advance that may help us find out more quickly which avenues are worth exploring and which are cul-de-sacs. I suspect we will find out some useful things from the RDoC project: I just have reservations as to whether they will be of any benefit to psychiatry, or more importantly, to psychiatric patients.


References

Foti, D., Kotov, R., & Hajcak, G. (2013). Psychometric considerations in using error-related brain activity as a biomarker in psychotic disorders. Journal of Abnormal Psychology, 122(2), 520-531. doi: 10.1037/a0032618


Frances, A. (2013). Saving normal: An insider's revolt against out-of-control psychiatric diagnosis, DSM-5, big pharma, and the medicalization of ordinary life. New York: HarperCollins.


Kendell, R., & Jablensky, A. (2003). Distinguishing between the validity and utility of psychiatric diagnoses. American Journal of Psychiatry, 160, 4-12.


McLaren, N. (2011). Cells, Circuits, and Syndromes: A Critical Commentary on the NIMH Research Domain Criteria Project Ethical Human Psychology and Psychiatry, 13 (3), 229-236 DOI: 10.1891/1559-4343.13.3.229


Munafò, M. R., & Gage, S. H. (2013). Improving the reliability and reporting of genetic association studies. Drug and Alcohol Dependence(0). doi: http://dx.doi.org/10.1016/j.drugalcdep.2013.03.023


Shilling, V. M., Chetwynd, A., & Rabbitt, P. M. A. (2002). Individual inconsistency across measures of inhibition: an investigation of the construct validity of inhibition in older adults. Neuropsychologia, 40, 605-619.


This article (Figshare version) can be cited as:

 Bishop, Dorothy V M (2014): Changing the landscape of psychiatric research: What will the RDoC initiative by NIMH achieve?. figshare. http://dx.doi.org/10.6084/m9.figshare.1030210 

Friday, May 9, 2014

Outlook for sea ice remains bleak


In April 2014, Arctic sea ice reached its annual maximum volume. It was the second lowest on record, according to calculations by the Pan-Arctic Ice Ocean Modeling and Assimilation System (PIOMAS) at the Polar Science Center. The ice volume in March 2014 also was the second lowest on record, as discussed in an earlier post. The fall in volume over the years is illustrated in the graph below, by Wipneus.
Another way of depicting the continuing fall in sea ice volume is the Arctic Death Spiral below, by Andy Lee Robinson.

The graph below, from the Danish Metereological Institute, shows mean temperatures that have been much higher than they used to be at higher latitudes. Mean 2 m temperatures for the region north of the 80th northern parallel as a function of the day of year are shown (red line), against the 1958 - 2002 mean (green line).


High levels of methane over the Arctic will have contributed to these high temperatures. Furthermore, the Jet Stream is changing as the difference in temperature between the Arctic and the equator decreases, causing more extreme weather events such as heatwaves and storms that could speed up the demise of snow and ice cover in the Arctic.

The graph below, by the Japan Aerospace Exploration Agency, shows that Arctic sea ice extent was 12,469,546 km² on May 8, 2014.

In addition, an El Niño event could cause even more ferocious heatwaves and storms to hit the Arctic. The image below, from IRI at Columbia University, shows that the chance of an El Niño event developing in the course of 2014 is close to 80%.


The outlook for the sea ice remains bleak and the possibility that a total collapse could occur in September calls for comprehensive and effective action, as discussed at the climate plan blog.


Sunday, May 4, 2014

Will the Anthropocene last for only 100 years?

On November 9, 2013, methane levels as high as 2662 ppb (parts per billion) were recorded, as indicated by the red dot on the image below.

This image, from an earlier post, gives an idea of the height of this level compared to historic methane levels, and how fast levels of methane (CH4) have been rising compared to levels of two other greenhouse gases, i.e. carbon dioxide (CO2) and nitrous oxide (N2O).

CO2 concentrations in the atmosphere have now risen to levels well above the 400 parts per million (ppm), as illustrated by the graph below, from keelingcurve.ucsd.edu. This 400 ppm is 143% the pre-industrial peak level of 280 ppm.

Paleorecords show that greenhouse gases levels go up and down in lockstep with temperatures in history. The image below shows that carbon dioxide levels back in history typically moved between approximately 180 ppm and 280 ppm, a difference of 100 ppm. Since 1950, CO2 levels have risen by roughly the same difference.


In a fascinating lecture, Dr Jan Zalasiewicz suggests that the Anthropocene started around 1950, when levels of greenhouse gases started to rise exponentially, in line with the rise of fossil fuel use, as also illustrated by the image below.


The image below, from an earlier post, shows that temperatures typically moved up and down by roughly 10 degrees Celsius between a glacial and interglacial phase of the ice ages, suggesting that a 100 ppm rise of carbon dioxide and 300 ppb rise of methane go hand in hand with a 10°C temperature rise.

Many eminent scientists have warned that the high current carbon dioxide levels have already locked us in for a future temperature rise of several degrees Celsius, a rise that is yet to fully manifest itself and that is only held off by the temporary masking effect of sulfur dioxide that is emitted when burning fuel (especially coal) and by the (decreasing) capacity of oceans, ice sheets and glaciers to act as a buffer for heat. Once the masking effect of sulfur dioxide ends and the Arctic sea ice collapses, a huge sudden rise in temperature can be expected, hitting vulnerable pools (see image below) which would accelerate the temperature rise even more and could cause temperatures to rise by another 10°C within decades.


The scenario of such a huge rise in temperature becomes a distinct possibility when considering the combined warming impact of carbon dioxide, methane, nitrous oxide, water vapor and albedo changes, and the vulnerability of some of the terrestrial and marine carbon pools. Also note that, while the above Unesco image gives an estimate of 104 or 10,000 Gt C for ocean methane hydrates, several studies give even higher estimates, as illustrated by the image below, from Pinero et al.


The amount of carbon stored in hydrates globally was in 1992 estimated to be 10,000 Gt (USGS), while a later source gives a figure of 63,400 Gt C for the Klauda & Sandler (2005) estimate of marine hydrates. A warming Gulf Stream is causing methane eruptions off the North American coast. Furthermore, methane appears to be erupting from hydrates on Antarctica, on the Qinghai-Tibetan Plateau and on Greenland. In just one part of the Arctic Ocean alone, the East Siberian Arctic Shelf (ESAS), up to 1700 Gt of methane is contained in sediments in the form of methane hydrates and free gas. A sudden release of just 3% of this amount could add over 50 Gt of methane to the atmosphere, i.e. some seven times what is in the atmosphere now, and experts consider such an amount to be ready for release at any time.

Importantly, methane levels have risen even more strongly than carbon dioxide levels. As the image at the top of this post shows, the current methane level is 250% its pre-industrial peak level, i.e. 1100 ppb above the pre-industrial peak level of 700 ppb. Historically, methane has only moved by some 300 ppb between a glacial and interglacial phase of the ice ages. IPCC/NOAA figures suggest that global mean methane levels have been rising by 5 or 6 ppb annually over recent years and there are some worrying indications that the rise of methane levels might accelerate even further.

To obtain mean methane abundance, measurements are typically taken at an altitude of 586 mb, as methane typically shows up most prominently at this altitude. Indeed, mean methane levels were highest at this altitude in April 2013, at just under 1800 ppb. Looking at mean global methane levels in April 2014 at this altitude, one could at first glance conclude that the situation had not changed much, and that 2014 methane levels had merely risen by a few ppb, in line with IPCC data. So, at first glance one might conclude that there may appear to be only a minimal rise (if any at all) in global mean methane levels when taking measurements at lower altitudes.

The image below illustrates this. What should be added is that the analysis used only selected altitudes and only used part of all data. So, further analysis may be necessary to verify these findings.


Importantly, closer examination of above graph shows that the situation is dramatically different when looking at the rise in methane levels at higher altitudes. A huge rise in mean methane levels appears to have taken place, to the extent that the highest mean level is now reached at 469 mb. Overall, the average rise in methane across the altitudes that are highlighted in the image is no less than 16 ppb.

The table below shows the altitude equivalents in mb (millibar) and feet.
56925 feet44689 feet36850 feet30569 feet25543 feet19819 feet14383 feet8367 feet1916 feet
74 mb147 mb218 mb293 mb367 mb469 mb586 mb742 mb945 mb

As the image below illustrates, this rise appears to go hand in hand with much higher peak readings, especially at higher altitudes. It appears that the additional methane originates from the higher latitudes of the Northern Hemisphere and has over the past few months moved closer to the equator, which is what typically occurs as methane rises in altitude.


Peak readings in above image are averages over April. On specific days, peak readings could be much higher, e.g. on April 28, 2014, methane levels were recorded as high as 2551 ppb at 469 mb.

As said, there appears to be a 16 ppb rise when comparing global mean methane levels between April 2013 and April 2014. Indeed, the culprit appears to be the rapid rise of methane emissions from hydrates that has been documented by this blog and that I estimated to amount to 99 Tg annually, as illustrated by the image below, from an earlier post.


So, it appears that the rise of methane in the atmosphere is accelerating. What can we expect? As temperatures can be expected to continue to rise and as feedbacks start to kick in, this may well constitute a non-linear trend. The image below shows a polynomial trend that is contained in IPCC AR5 data from 1955 to 2011, so they didn't include this recent steep rise. Nonetheless, the polynomial trendline points at methane reaching mean global levels higher than 3000 ppb by the year 2030. If methane starts to erupt in large quantities from clathrates underneath the seafloor of the Arctic Ocean, this may well be where we are heading.
So, how high could temperatures rise? Worryingly, a non-linear trend is also contained in the temperature data that NASA has gathered over the years, as described in an earlier post. A polynomial trendline points at global temperature anomalies of 5°C by 2060. Even worse, a polynomial trend for the Arctic shows temperature anomalies of 4°C by 2020, 7°C by 2030 and 11°C by 2040, threatening to cause major feedbacks to kick in, including albedo changes and methane releases that will trigger runaway global warming that looks set to eventually catch up with accelerated warming in the Arctic and result in global temperature anomalies of 20°C+ by 2050.


Without action, it appears that the Antropocene will lead to extinction of the very human beings after which the era is named, with the Anthropocene only running from 1950 to 2050, a mere 100 years and much too short to constitute an era. In that case a better name would be the Sixth Extiction Event, as also illustrated by the image below, from an earlier post.


In conclusion, it's high time that we start acting as genuinely wise modern human beings and commit to comprehensive and effective action as discussed at the Climate Plan blog.