Showing posts with label education. Show all posts

Sunday, September 14, 2014

International reading comparisons: is England really doing so poorly?

I was surprised to see a piece in the Guardian stating that "England is one of the most unequal countries for children's reading levels, second in the EU only to Romania". This claim was made in an article about a new campaign, Read On, Get On, that was launched this week.


The campaign sounds great. A consortium of organizations and individuals have got together to address the problem of poor reading: the tail in the distribution of reading ability that seems to stubbornly remain, despite efforts to reduce it. Poor readers are particularly likely to come from deprived backgrounds, and their disadvantage will be perpetuated, as they are at high risk of leaving school with few qualifications and dismal employment prospects. I was pleased to see that the campaign has recognized weak language skills in young children as an important predictor of later reading difficulties. The research evidence has been there for years (Kamhi & Catts, 2011), but it has taken ages to percolate into practice, and few teachers have any training in language development.


But! You knew there was a 'but' coming. It concerns the way the campaign has used evidence. They've mostly based what they say on the massive Progress in International Reading Literacy Study (PIRLS), and the impression is they have exaggerated the negative in order to create a sense of urgency.


I took a look at the Read On Get On report. The language is emotive and all about blame: "The UK has a sorry history of educational inequality. For many children, this country provides enormous and rich opportunities. At the top end of our education system we rival the best in the world. But it has long been recognised that we let down too many children who are allowed to fall behind. Many of them are condemned to restricted horizons and limited opportunities." I was particularly interested in the international comparisons, with claims such as "The UK is one of the most unfair countries in the developed world."


So how were such conclusions reached? Read On, Get On commissioned the National Foundation for Educational Research (NFER) to compare levels of reading attainment in the UK with that of other developed countries, with a focus on children approaching the last year of primary schooling.


Given the negative tone of "letting down children", it was interesting to read that "In terms of its overall average performance, NFER’s research found England to be one of the best performing countries." I put that in bold because, somehow, it didn't make it into the Guardian, so is easy to miss. It is in any case dismissed by the NFER report in a sentence: "As a wealthy country with a good education system, that is to be expected."


The evidence of the parlous state of UK education came from consideration of the range of scores from best (95th percentile) to worst (5th percentile) for children in England. Now this is where I think it gets a bit dishonest. Suppose there were a massive improvement in scores for a subset of children, such that the mean and highest scores went up, but with the lowest scoring still doing poorly; presumably, the shrill voices would get even shriller, because the range would extend even further. This seems a tad unfair: yes, it makes sense to stress that the average attainment doesn't capture important things, and that a high average is not a cause for congratulation if it is associated with a long straggly tail of poor achievers. But if we want to focus on poor achievers, let's look at the proportion of children scoring at a low level, and not at some notional 'gap' between best and worst, which is then translated into 'years' to make it sound even more dramatic.


The question is how does England compare with other countries if we just look at the absolute level of the low score corresponding to the 5th percentile. Answer: not brilliant – 16th out of the 24 countries featured in the subset considered by the NFER survey. But, rather surprisingly, we find that the NFER survey excluded New Zealand and Australia, both of whom did worse than England.


So do we notice anything about that? Well, in all three countries, children are learning English, a language widely recognized as creating difficulty for young readers because of the lack of consistent mapping between letters (orthography) and sounds (phonology). In fact, when looking for sources for this blogpost, I happened upon a report from an earlier tranche of PIRLS data, which examined this very topic, by assigning an 'orthographic complexity' score to different languages. The authors found a correlation of .6 between the range of scores (5th to 95th percentile again, this time for 2003 data) and a measure of complexity of the orthography. I applied their orthography rating scale to the 2011 PIRLS data and found that, once again the range of reading scores was significantly related to orthography (r = .72), with the highest ranges for those countries where English was spoken – see Figure below. (NB it would be very interesting to extend this to include additional countries: I was limited to the languages with an orthographic rating from the earlier report).


PIRLS 2011 data: range of reading attainment vs. orthographic complexity

International comparisons have their uses, and in this case they seem to suggest that a complex orthography widens the gap between the best and worst readers. However, they still need to be treated with caution. I haven't had time to delve into PIRLS in any detail, but just looking at how samples of children were selected, it is clear that criteria varied. In particular, there were differences from country to country in terms of whether they excluded children who were non-native speakers of the test language, and whether they included those with special educational needs. Romania, which had the most extreme range of scores between best and worst, excluded nobody. Finand, which tends to do well in these surveys, excluded "students with dyslexia or other severe linguistic disorders, intellectually disabled students, functionally disabled students, and students with limited proficiency in the assessment language." England excluded "students with significant special educational needs". Needless to say, all of these criteria are open to interpretation.


I'm not saying that the tail of the distribution is unimportant. Yes, of course, we need to do our best to ensure that all children are competent readers, as we know that poor literacy is a major handicap to a person's prospects for employment, education and prosperity. But let's stop beating ourselves over the head about this. Research indicates that the reasons for children's literacy problems are complex and will be influenced by the writing system they have to learn (Ziegler & Goswami, 2005) and constitutional factors (Asbury & Plomin, 2013), as well as by the home and school environment: we still have only a poor grasp of how these different factors interact. Until we gain a better understanding, we should of course put in our best efforts to help those children who are struggling. The enthusiasm and good intentions of those behind Read On, Get On are to be welcomed, but their spin on the PIRLS data is unhelpful in implying that only social factors are important.


References

Asbury K, and Plomin R. 2013. G is for genes: The impact of genetics on education and achievement. Chichester: Wiley Blackwell.


Kamhi AG, and Catts HW. 2011. Language and Reading Disabilities (3rd Edition): Allyn & Bacon.


Ziegler JC, & Goswami U (2005). Reading acquisition, developmental dyslexia, and skilled reading across languages: a psycholinguistic grain size theory. Psychological bulletin, 131 (1), 3-29 PMID: 15631549

Saturday, January 25, 2014

What is educational neuroscience?


©CartoonStock.com


As someone who works at the interface of child development and neuroscience, I've been struck by the relentless rise of the sub-discipline of 'educational neuroscience'. New imaging technologies have led to a burgeoning of knowledge about the developing brain, and it is natural to want to apply this knowledge to improving children's learning. Centres for educational neuroscience have sprung up all over the place, with support from universities who see them as ticking two important boxes: interdisciplinarity and impact.


But at the heart of this enterprise, there seems to be a massive disconnect. Neuroscientists can tell you which brain regions are most involved in particular cognitive activities and how this changes with age or training. But these indicators of learning do not tell you how to achieve learning. Suppose I find out that the left angular gyrus becomes more active as children learn to read. What is a teacher supposed to do with that information?


As John Bruer pointed out back in 1997, the people who can be useful to teachers are psychologists. Psychological experiments can establish the cognitive underpinnings of skills such as reading, and can evaluate which are the most effective ways of teaching, and whether these differ from child to child. They can address questions such as whether there are optimal ages at which to teach different skills, how motivation and learning interact, and whether it is better to learn material in large chunks all at once or spaced out over intervals. At a trivial level, these could all be designated as aspects of 'educational neuroscience', insofar as the brain is necessarily involved in cognition and motivation. But they can all be studied without taking any measurements of brain function.


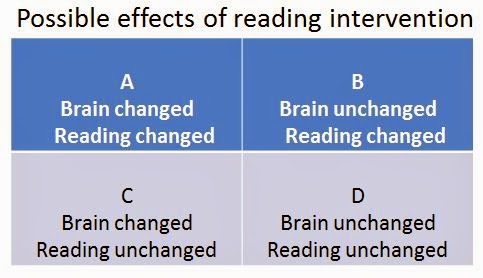
It is possible, of course, to look at the brain correlates of all of these things, but that's unlikely to influence what's done in the classroom. Suppose I want to see whether training in phonological awareness improves children's reading outcomes. I measure brain activation before and after training, and compare results with those of a control group who don't get the training. There are various possible patterns of results, as laid out in the table below:


As pointed out by Coltheart and McArthur (2012), what matters to the teacher is whether the training is effective in improving reading. It's really not going to make any difference whether detectable brain changes have happened, so either outcome A or B would give good justification for adopting the training, whereas outcomes C and D would not.


Well, you might say, children differ, and the brain measures might show up differences between those who do and don't respond to training. Indeed, but how would that be useful educationally? I've seen several studies that propose brain scans might be useful in identifying which children will and won't benefit from an intervention. That's a logical possibility, but given that brain scanning costs several hundred pounds per person, it's not realistic to suggest this has any utility in the real world, especially when there are likely to be behavioural indicators that predict outcomes just as well.


So are there actual or potential examples of how knowledge of neuroscience - as opposed to psychology - might influence educational practice? I mentioned three examples in this review: neurofeedback, neuropharmacology and brain stimulation are all methods that focus directly on changing the brain in ways that might potentially affect learning, and so could validly be designated as educational neuroscience. They are, however, as yet exploratory and experimental. The last of these, brain stimulation, was described this week in a blogpost by Roi Cohen Kadosh, who notes promising early results, but emphasizes that we need more experimental work establishing both risks and benefits before we could consider direct application of this method to improving children's learning.


I'm all in favour of cognitive neuroscience and basic research that discovers more about the neural underpinnings of typical and atypical development. By all means, let's do such studies, but let's do them because we want to find out more about the brain, and not pretend it has educational relevance.


If our goal is to develop better educational
interventions, then we should be directing research funds into
well-designed trials of cognitive and behavioural studies of learning,
rather than fixating on neuroscience. Let me leave the last word to Hirsh-Pasek and Bruer, who described a Chilean conference in 2007 on Early Education and Human Brain Development. They noted: "The Chilean educators were looking to brain science for insights about which type of preschool would be the most effective, whether children are safe in child care, and how best to teach reading. The brain research presented at the conference that day was mute on these issues. However, cognitive and behavioral science could help."


References

Bishop, D. V. M. (2013). Neuroscientific studies of intervention for language impairment in children: interpretive and methodological problems Journal of Child Psychology and Psychiatry, 54 (3), 247-259 DOI: 10.1111/jcpp.12034


Bruer, J. T. (1997). Education and the brain: A bridge too far. Educational researcher, 26(8), 4-16. doi: 10.3102/0013189X026008004


Coltheart, M., & McArthur, G. (2012). Neuroscience, education and educational efficacy research. In M. Anderson & S. Della Sala (Eds.), Neuroscience in Education (pp. 215-221). Oxford: Oxford University Press.


This article (Figshare version) can be cited as: 

Bishop, Dorothy V M (2014): What is educational neuroscience?. figshare.
http://dx.doi.org/10.6084/m9.figshare.1030405

Saturday, October 5, 2013

Good and bad news on the phonics screen


Teaching children to read is a remarkably fraught topic. Last year the UK Government introduced a
screening check to assess children’s ability to use phonics – i.e., to decode
letters into sounds. Judging from the reaction in some quarters they might as well have announced they were going to teach 6-year-olds calculus. The test, we were
told, would confuse and upset children and not tell teachers anything they did
not already know. Some people implied
that there was an agenda to teach children to read solely using meaningless
materials. This, of course, is not the case. Nonwords are used in assessment
precisely because you need to find out if the child has the skills to attack an
unfamiliar word by working out the sounds. Phonics has been ignored or rejected
for many years by those who assumed that if you taught phonics the child would
be doomed to an educational approach that involved boring drills in meaningless
materials. This is not the case: for
instance, Kevin Wheldall argues that children need to combine teaching of phonics with training in vocabulary and comprehension, and storybook reading
with real texts should be a key component of reading instruction.


There is evidence for the effectiveness of phonics training from
controlled trials,  and I therefore regard it as a positive move
that the government has endorsed the  use
of phonics in schools. However, they continue to meet resistance from many
teachers, for a whole range of reasons. Some just don’t like phonics. Some don’t
like testing children, especially when the outcome is a pass/fail
classification. Many fear that the government will use results of a screening
test to create league tables of schools, or to identify bad teachers. Others question the whole point of screening: This recent piece from the BBC website quotes Christine Blower, the head of the National Union of Teachers, as saying: "Children develop at different levels, the slow reader at five can
easily be the good reader by the age of 11.
” To anyone familiar with the
literature on predictors of children’s reading, this shows startling levels of complacency and ignorance. We have known for years that you can predict with
good accuracy which children are likely to be poor readers at 11 years from
their reading ability at 6 (Butler et al, 1985).


When the results from last year's phonics screen came out I blogged about them, because they looked disturbingly dodgy, with a spike in the frequency distribution at the pass mark of 32. On Twitter, @SusanGodsland has pointed me to a report on the 2012 data where
this spike was discussed. This noted that the spike in the distribution was not seen in a pilot study
where the pass mark had not been known in advance. The spike was played down
in this report, and attributed to “teachers accounting for potential
misclassification in the check results, and using their teacher judgment to
determine if children are indeed working at the expected standard
.” It was
further argued that the impact of the spike was small, and would lead to only
around 4% misclassification.


However, a more detailed research report on the results was rather less mealy-mouthed
about the spike and noted “the national distribution of scores suggests that
pupils on the borderline may have been marked up to meet the expected
standard
.” The authors of that report did the best they could with the data and
carried out two analyses to try to correct for the spike. In the first, they
deleted points in the distribution where the linear pattern of increase in
scores was disrupted, and instead interpolated the line. They concluded that
this gave 54% rather than 58% of children passing the screen. The second approach, which they described as
more statistically robust, was to take all the factors that they had measured
that predicted scores on the phonics screen, ignoring cases with scores close to the
spike, and then use these to predict the percentage passing the screen in the
whole population. When this method was
used, only 46% of children were estimated to have passed the screen when the
spike was corrected for.


Well, this year’s results have just been published. The good news is that there is an impressive increase in percentage of children passing
from 2012 to 2013, up from 58% to 69%. This suggests that
the emphasis on phonics is encouraging teachers to teach children about how letters and sounds go together.


But any positive reaction to this news is
tinged with a sense of disappointment that once again
we have a most peculiar distribution with a spike at the
pass
mark. 


Proportions of children with different scores on phonics screen in 2012 and 2013. Dotted lines show interpolated values.


I applied the same correction as had been used for the 2012 data,
i.e.
interpolating the curve over the dodgy area. This suggested that the
proportion of cases passing the screen was overestimated by about 6%
for both 2012 and 2013. (The precise figure will depend on the exact way
the interpolation is done).


Of course I recognise that any pass mark is arbitrary, and
children’s performance may fluctuate and not always represent their true
ability. The children who scored just below the pass mark may indeed not
warrant extra help with reading, and one can see how a teacher may be tempted
to nudge a score upward if that is their judgement. Nevertheless, teachers who
do this are making it difficult to rely on the screen data and to detect
whether there are any improvements year on year. And it undermines their
professional status if they cannot be trusted to administer a simple reading test objectively.


It has been announced that the pass mark for the phonics screen won’t be
disclosed in advance in 2014, which should reduce the tendency to nudge scores
up. However, if the pass mark differs from
previous years, then the tests won’t be comparable, so it seems likely that
teachers will be able to guess it will remain at 32. Perhaps one solution would
be to ask the teacher to make a rating of whether or not the
test result agrees with their judgement of the child’s ability. If they have an
opportunity to give their professional opinion, they may be less tempted to
tweak test results. I await with interest the results from 2014!


Reference

Butler, Susan R., Marsh, Herbert W., Sheppard, Marlene J., & Sheppard, John L (1985). Seven-year longitudinal study of the early prediction of reading achievement Journal of Educational Psychology, 77, 349-361 DOI: 10.1037//0022-0663.77.3.349