Saturday, July 6, 2013

Wildfires in Canada affect the Arctic

created by Sam Carana with screenshot from wunderground.com
Wildfires can cause a lot of emissions. Obviously, when wood burns, carbon dioxide is emitted into the atmosphere. Wildfires also cause further emissions, such as methane, soot and carbon monoxide. A large part of such emissions can be broken relatively quickly down by hydroxyl, but when large emissions take place, this can take a while. In other words, the lifetime of gases such as methane is extended, particularly in the Arctic where hydroxyl levels are already very low to start with.

Furthermore, the soot that is emitted by such wildfires can settle down on snow and ice, changing its albedo and thus contributing to the demise of the snow and ice cover. As the image shows, soot can be blown high up into the Arctic, depending on the direction of the wind.

Wildfires in Canada and Alaska have now been raging for quite some time. The above image dates back to late last month. Today's images can be quite similar, as illustrated by the two images below.

created by Sam Carana with screenshot from wunderground.com
Smoke from wildfires can travel over quite long distances, as also evidenced by these NASA satellite images showing wildfire smoke crossing the Atlantic Ocean. The relation between wildfire smoke and methane concentrations is further illustrated by the image below.

methane levels July 5, 2013, over 1950 ppb in yellow in 6 layers from 718-840 mb
created by Sam Carana with methanetracker.org - sea ice data by SSMIS
Below, a similar image showing methane on the afternoon of July 6, 2013.

methane levels July 6, 2013, over 1950 ppb in yellow, 7 layers from 469-586 mb
created by Sam Carana with methanetracker.org - sea ice data by SSMIS
Below, a screenshot created with methanetracker, showing some methane still persisting on July 8, 2013.  On the right, the methane originating from the Quebec wildfires appears to have moved farther over the Atlantic Ocean, due to the Coriolis effect. The image also shows some worryingly high methane concentrations in spots above the Arctic sea ice. The spots north of Alaska were also examined in the video at Cruising for methane.

methane levels on the morning of July 8, 2013, over 1950 ppb in yellow, 10 layers from 545 to 742 mb
created by Sam Carana with methanetracker.org
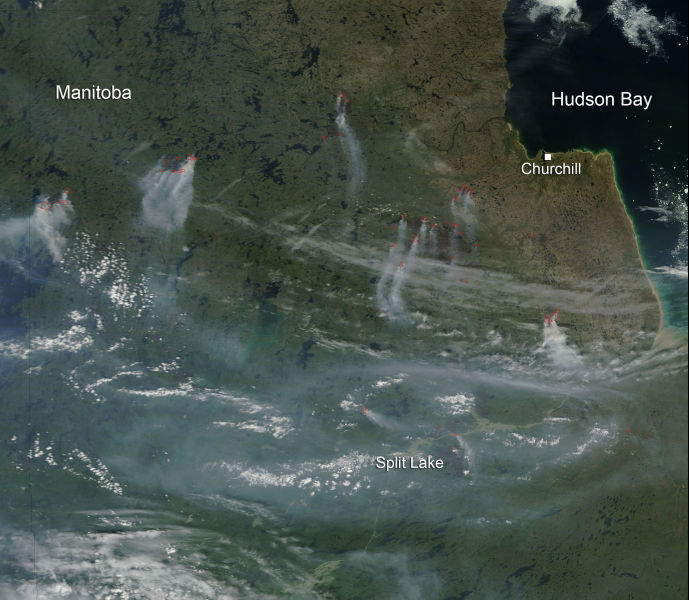
Below, a NASA satellite picture showing wildfires in Manitoba, Canada, captured by Terra satellite on June 29, 2013.

NASA image courtesy Jeff Schmaltz, MODIS Rapid Response Team
In conclusion, while carbon pollution gets a lot of attention, the Arctic is also strongly affected by other emissions that can result from wildfires.

Cruising for methane


Cruising for methane with Sam Carana, a video at youtube.com/watch?v=3l6PtWf4i9w

Sunday, June 30, 2013

Cyclonic Activity persists in Arctic


Above image, edited from Naval Research Laboratory, shows that a large area has developed at the center of the Arctic Ocean with very thin ice, at some places down to virtually zero, i.e. open water.

This development is to a large extent caused by persistent cyclonic activity in the Arctic. The Arctic is warming up faster than anywhere else, and this is reducing the temperature difference between the Arctic and lower latitudes. As a result, the polar vortex and jet stream get distorted, resulting in extreme weather. This is graphically illustrated by the animation below, from the California Regional Weather Server.


Note: this animation is a 2.5 MB file that may take some time to fully load.
Credit: California Regional Weather Server

Related

Open Water In Areas Around North Pole - June 22, 2013
http://arctic-news.blogspot.com/2013/06/open-water-in-areas-around-north-pole.html

Thin Spots developing in Arctic Sea Ice - June 13, 2013
http://arctic-news.blogspot.com/2013/06/thin-spots-developing-in-arctic-sea-ice.html

Polar jet stream appears hugely deformed - December 20, 2012

Changes to Polar Vortex affect mile-deep ocean circulation patterns - September 24, 2012
http://arctic-news.blogspot.com/2012/09/changes-to-polar-vortex-affect-mile-deep-ocean-circulation-patterns.html

Diagram of Doom - August 28, 2012
http://arctic-news.blogspot.com/2012/08/diagram-of-doom.html

Opening further Doorways to Doom - August 28, 2012
http://arctic-news.blogspot.com/2012/08/opening-further-doorways-to-doom.html

Huge cyclone batters Arctic sea ice - August 11, 2012

Thursday, June 27, 2013

The Threat of Wildfires in the North

NASA/NOAA image based on Suomi NPP satellite data from April 2012 to April 2013, with grid added
A new map has been issued by NOAA/NASA. The map shows that most vegetation grows in two bands, i.e. the Tropical Band (between latitudes 15°N and 15°S) and the Northern Band in between 45°N and 75°N, i.e. in North America, Europe and Siberia. On above image, the map is roughly overlayed with a grid to indicate latitude and longitude co-ordinates.


Vegetation in the Northern Band extends beyond the Arctic Circle (latitude 66° 33′ 44″ or 66.5622°, in blue on above image from Arcticsystem.no) into the Arctic, covering sparsely-populated areas such in Siberia, Alaska and the northern parts of Canada and Scandinavia. Further into the Arctic, there are huge areas with bush and shrubland that have taken thousands of years to develop, and once burnt, it can take a long time for vegetation to return, due to the short growing season and harsh conditions in the Arctic.


Above map with soil carbon content further shows that the top 100 cm of soil in the northern circumpolar region furthermore contains huge amounts of carbon.

May 16 2013 Drought 90 days Arctic
Global warming increases the risk of wildfires. This is especially applicable to the Arctic, where temperatures have been rising faster than anywhere else on Earth. Anomalies can be very high in specific cases, as illustrated by the temperature map below. High temperatures and drought combine to increase the threat of wildfires (see above image showing drought severity).

June 25, 2013 from Wunderground.com - Moscow broke its more than 100-year-old record for the hottest June 27
Zyryanka, Siberia, recently recorded a high of 37.4°C (99.3°F), against normal high temperatures of 20°C to 21°C for this time of year. Heat wave conditions were also recorded in Alaska recently, with temperatures as high as 96°F (36°C).

On June 19, 2013, NASA captured this image of smoke from wildfires burning in western Alaska. The smoke was moving west over Norton Sound. (The center of the image is roughly 163° West and 62° North.) Red outlines indicate hot spots with unusually warm surface temperatures associated with fire. NASA image by Jeff Schmaltz, LANCE/EOSDIS Rapid Response. Caption by Adam Voiland. - also see this post with NASA satellite image of Alaska.
Siberian wildfires June 21, from RobertScribbler 
from methanetracker.org

Wildfires raged in Russia in 2010. Flames ravaged 1.25 million hectares (4,826 mi²) of land including 2,092 hectares of peat moor.

Damage from the fires is estimated to be $15 billion, in a report in the Guardian.

Cost of fire-fighting efforts and agricultural losses alone are estimated at over $2bn, reports Munich Re, adding that Moscow's inhabitants suffered under a dense cloud of smoke which enveloped the city. In addition to toxic gases, it also contained considerable amounts of particulate matter. Mortality increased significantly: the number of deaths in July and August was 56,000 higher than in the same months in 2009. 


[From: Abrupt Local Warming, May 16, 2012]

Wildfires in the North threaten to cause large emissions of greenhouse gases and soot, which can settle on snow and ice in the Arctic and the Himalayan Plateau, with the resulting albedo changes causing a lot more sunlight to be absorbed, instead of reflected as was the case earlier. This in turn adds to the problem. Additionally, rising temperatures in the Arctic threaten to cause release of huge amounts of methane from sediments below the Arctic Ocean. This situation threatens to escalate into runway global warming in a matter of years, as illustrated by the image below.

How much will temperatures rise?
In conclusion, the risk is unacceptable and calls for a comprehensive and effective action plan that executes multiple lines of action in parallel, such as the 3-part Climate Action Plan below. Part 1 calls for a sustainable economy, i.e. dramatic reductions of pollutants on land, in oceans and in the atmosphere. Part 2 calls for heat management. Part 3 calls for methane management and further measures.


The Climate Action Plan set out in above diagram can be initiated immediately in any country, without the need for an international agreement to be reached first. This can avoid delays associated with complicated negotiations and on-going verification of implementation and progress in other nations.

In nations with both federal and state governments, such as the United States of America, the Climate Action Plan could be implemented as follows:
  • The President directs federal departments and agencies to reduce their emissions for each type of pollutant annually by a set percentage, say, CO2 and CH4 by 10%, and HFCs, N2O and soot by higher percentages.
  • The President demands states to each make the same cuts. 
  • The President directs the federal Environmental Protection Agency (EPA) to monitor implementation of states and to act step in where a state looks set to fail to miss one or more targets, by imposing (federal) fees on applicable polluting products sold in the respective state, with revenues used for federal benefits.
Such federal benefits could include building interstate High-Speed Rail tracks, adaptation and conservation measures, management of national parks, R&D into batteries, ways to vegetate deserts and other land use measurements, all at the discretion of the EPA. The fees can be roughly calculated as the average of fees that other states impose in successful efforts to meet their targets.

This way, the decision how to reduce targets is largely delegated to state level, while states can similarly delegate decisions to local communities. While feebates, preferably implemented locally, are recommended as the most effective way to reach targets, each state and even each local community can largely decide how to implement things, provided that each of the targets are reached.

Similar targets could be adopted elsewhere in the world, and each nation could similarly delegate responsibilities to local communities. Additionally, it makes sense to agree internationally to impose extra fees on international commercial aviation, with revenues used to develop ways to cool the Arctic.

- Climate Plan

Saturday, June 22, 2013

Open Water In Areas Around North Pole

In some areas around the North Pole, thickness of the sea ice has declined to virtually zero, i.e. open water.


What could have caused this open water? Let's go through some of the background.

North Hemisphere snow cover has been low for some time. Snow cover in May 2013 was the lowest on record for Eurasia. There now is very little snow left, as shown on the image right, adapted from the National Ice Center.

Low snow cover is causing more sunlight to be absorbed, rather than reflected back into space. As can be expected, there now are high surface temperatures in many areas, as illustrated by the NOAA image below. Anomalies can be very high in specific cases. Zyryanka, Siberia, recently recorded a high of 37.4 C, against normal high temperatures of 20 C to 21 C for this time of year. Heat wave conditions were also recorded in Alaska recently (satellite image of Alaska below).

NASA image June 17, 2013, credit: NASA/Jeff Schmaltz, LANCE MODIS Rapid Response Team, NASA GSFC - from caption by Adam Voiland: "Talkeetna, a town about 100 miles north of Anchorage, saw temperatures reach 96°F (36°C) on June 17. Other towns in southern Alaska set all-time record highs, including Cordova, Valez, and Seward. The high temperatures also helped fuel wildfires and hastened the breakup of sea ice in the Chukchi Sea."
Accordingly, a large amount of relatively warm water from rivers has flowed into the Arctic Ocean, in addition to warm water from the Atlantic and Pacific Oceans.


Sea surface temperatures have been anomalously high in many places around the edges of the sea ice, as also shown on the NOAA image below.


Nonetheless, as the above images also make clear, sea surface temperatures closer to the North Pole have until now remained at or below zero degrees Celsius, with sea ice cover appearing to remain in place. The webcam below from the North Pole Environmental Observatory shows that there still is a lot of ice, at least in some parts around the North Pole.

Webcam #2 of the North Pole Environmental Observatory monitoring UPMC's Atmospheric Buoy, June 21, 2013
So, what could have caused the sea ice to experience such a dramatic thickness decline in some areas close to the North Pole?

Firstly, as discussed in earlier posts, there has been strong cyclonic activity over the Arctic Ocean (see also Arctic Sea Ice blog post). This has made the sea ice more prone and vulnerable to the rapid decline that is now taking place in many areas.

Furthermore, Arctic sea ice thickness is very low, as illustrated by the image below.

Arctic sea ice volume/extent ratio, adapted by Sam Carana from an image by Neven (click to enlarge)
Finally, there has been a lot of sunshine at the North Pole. At this time of year, insolation in the Arctic is at its highest. Solstice (June 20 or June 21, 2013, depending on time zone) is the day when the Arctic receives the most hours of sunlight, as Earth reaches its maximum axial tilt toward the sun of 23° 26'. In fact, insolation during the months June and July is higher in the Arctic than anywhere else on Earth, as shown on the image below.

Monthly insolation for selected latitudes -  adapted from Pidwirny, M. (2006), in "Earth-Sun Relationships and Insolation",  Fundamentals of Physical Geography, 2nd Edition. 
In conclusion, the current rapid sea ice thickness decline close to the North Pole is mostly due to a combination of earlier cyclonic activity and lots of sunlight, while the sea ice was already very thin to start with. The cyclone broke up the sea ice at the center of the Arctic Ocean, which is turn made it more prone to melting rapidly. The cyclone did more, though, as contributor to the Arctic-news blog Veli Albert Kallio explains:
"The ocean surface freezes if the temperature falls below -2.5C. The reason for the negative melting point is the presence of 4-5% of sea salt. Only in the polar regions does the sea surface cool sufficiently for sea ice to form during winters.

The sea ice cover is currently thinning near the North Pole between 80-90 degrees north. This part of the ocean is very deep. It receives heat of the Gulf Stream from the south: as the warm water vapourises, its salt content to water increases. This densifies the Gulf Stream which then falls onto the sea floor where it dissipates its heat to the overlying water column. The deep basin of the Arctic Ocean is now getting sufficiently warmed for the thin sea ice cover to thin on top of it. The transportation of heat to the icy surface is combined with the winds that push cold surface water down while rising heat to surface."
Indeed, vertical mixing of the water column was enhanced due to cyclonic activity, and this occurred especially in the parts of the Arctic Ocean that also are the deepest, as illustrated by the animation below.
Legend right: Ice thickness in m from Naval Research Laboratory
Legend bottom: Sea depth (blue) and land height (brown/green)
in m from NIBCAO Arctic map at NOAA
The compilation of images below shows how the decline of sea ice has taken place in a matter of weeks.

[ click to enlarge ]
This spells bad news for the future. It confirms earlier analyses (see links below) that the sea ice will disappear altogether within years. It shows that the sea ice is capable of breaking up abruptly, not only at the outer edges, but also at the center of the Arctic Ocean. As the Arctic sea ice keeps declining in thickness, it does indeed look set to break up and disappear abruptly across most of the Arctic Ocean within a few years. Models that are based on sea ice merely shrinking slowly from the outer edges inward should reconsider their projections accordingly.

Related

- Getting the Picture
http://arctic-news.blogspot.com/2012/08/getting-the-picture.html

- Supplementary evidence by Prof. Peter Wadhams
http://arctic-news.blogspot.com/2012/04/supplementary-evidence-by-prof-peter.html

Thursday, June 20, 2013

Discussion meeting vs conference: in praise of slower science


Pompeii mosaic

Plato conversing with his students


As time goes by, I am increasingly unable to enjoy big conferences. I'm not sure how much it's a change in me or a change in conferences, but my attention span shrivels after the first few talks. I don't think I'm alone. Look around any conference hall and everywhere you'll see people checking their email or texting. I usually end up thinking I'd be better off staying at home and just reading stuff.


All this made me start to wonder, what is the point of conferences?  Interaction should be the key thing that a conference can deliver. I have in the past worked in small departments, grotting away on my own without a single colleague who is interested in what I'm doing. In that situation, a conference can reinvigorate your interest in the field, by providing contact with like-minded people who share your particular obsession. And for early-career academics, it can be fascinating to see the big names in action. For me, some of the most memorable and informative experiences at conferences came in the discussion period. If X suggested an alternative interpretation of Y's data, how did Y respond: with good arguments or with evasive arrogance? And how about the time that Z noted important links between the findings of X and Y that nobody had previously been aware of, and the germ of an idea for a new experiment was born?


I think my growing disaffection with conferences is partly fuelled by a decline in the amount and standard of discussion at such events. There's always a lot to squeeze in, speakers will often over-run their allocated time, and in large meetings, meaningful discussion is hampered by the acoustic limitations of large auditoriums. And there's a psychological element too: many people dislike public discussion, and are reluctant to ask questions for fear of seeming rude or self-promotional (see comments on this blogpost for examples). Important debate between those doing cutting-edge work may take place at the conference, but it's more likely to involve a small group over dinner than those in the academic sessions.


Last week, the Royal Society provided the chance for me, together with Karalyn Patterson and Kate Nation, to try a couple of different formats that aimed to restore the role of discussion in academic meetings. Our goal was to bring together researchers from two fields that were related but seldom made contact: acquired and developmental language disorders. Methods and theories in these areas have evolved quite separately, even though the phenomena they deal with overlap substantially.


The Royal Society asks for meeting proposals twice a year, and we were amazed when they not only approved our proposal, but suggested we should have both a Discussion Meeting at the Royal Society in London, and a smaller Satellite meeting at their conference centre at Chicheley Hall in the Buckinghamshire countryside.


We wanted to stimulate discussion, but were aware that if we just had a series of talks by speakers from the two areas, they would probably continue as parallel, non-overlapping streams. So we gave them explicit instructions to interact. For the Discussion meeting, we paired up speakers who worked on similar topics with adults or children, and encouraged them to share their paper with their "buddy" before the meeting. They were asked to devote the last 5-10 minutes of their talk to considering the implications of their buddy's work for their own area. We clearly invited the right people, because the speakers rose to this challenge magnificently. They also were remarkable in all keeping to their allotted 30 minutes, allowing adequate time for discussion. And the discussion really did work: people seemed genuinely fired up to talk about the implications of the work, and the links between speakers, rather than scoring points off each other.


After two days in London, a smaller group of us, feeling rather like a school party, were wafted off to Chicheley in a special Royal Society bus. Here we were going to be even more experimental in our format. We wanted to focus more on early-career scientists, and thanks to generous funding from the Experimental Psychology Society, we were able to include a group of postgrads and postdocs. The programme for the meeting was completely open-ended. Apart from a scheduled poster session, giving the younger people a chance to present their work, we planned two full days of nothing but discussion. Session 1 was the only one with a clear agenda: it was devoted to deciding what we wanted to talk about.


We were pretty nervous about this: it could have been a disaster. What if everyone ran out of things to say and got bored? What if one or two loud-mouths dominated the discussion? Or maybe most people would retire to their rooms and look at email. In fact, the feedback we've had concurs with our own impressions that it worked brilliantly. There were a few things that helped make it a success.


  • The setting, provided by the Royal Society, was perfect. Chicheley Hall is a beautiful stately home in the middle of nowhere. There were no distractions, and no chance of popping out to do a bit of shopping. The meeting spaces were far more conducive to discussion than a traditional lecture theatre.

  • The topic, looking for shared points of interest in two different research fields, encouraged a collaborative spirit, rather than competition.

  • The people were the right mix. We'd thought quite carefully about who to invite; we'd gone for senior people whose natural talkativeness was powered by enthusiasm rather than self-importance. People had complementary areas of expertise, and everyone, however senior, came away feeling they'd learned something.

  • Early-career scientists were selected from those applying, on the basis that their supervisor indicated they had the skills to participate fully in the experience. Nine of them were selected as rapporteurs, and were required to take notes in a break-out session, and then condense 90 minutes of discussion into a 15-minute summary for the whole group.  All nine were quite simply magnificent in this role, and surpassed our expectations. The idea of rapporteurs was, by the way, stimulated by experience at Dahlem conferences, which pioneered discussion-based meetings, and subsequent Strüngmann forums, which continue the tradition.

  • Kate Nation noted that at the London meeting, the discussion had been lively and enjoyable, but largely excluded younger scientists. She suggested that for our discussions at Chicheley, nobody over the age of 40 should be allowed to talk for the first 10 minutes. The Nation Rule proved highly effective - occasionally broken, but greatly appreciated by several of the early career scientists, who told us that they would not have spoken out so much without this encouragement.


I was intrigued to hear from Uta Frith that there is a Slow Science movement, and I felt the whole experience fitted with their ethos: encouraging people to think about science rather than frenetically rushing on to the next thing. Commentary on this has focused mainly on the day-to-day activities of scientists and publication practices (Lutz, 2012). I haven't seen anything specifically about conferences from the Slow Science movement (and since they seem uninterested in social media, it's hard to find out much about them!), but I hope that we'll see more meetings like this, where we all have time to pause, ponder and discuss ideas.


Reference

Lutz, J. (2012). Slow science Nature Chemistry, 4 (8), 588-589 DOI: 10.1038/nchem.1415

Extreme weather becomes the norm - what can you do?

. . a sky that has turned red due to greenhouse gases, while the land is flooded. The handful of
people who survived are standing by helplessly on higher grounds, in despair and without hope,
while one figure turns to me in panic and pain, uttering nothing but a silent scream . . .
(comment by Sam Carana, March 8, 2012, on auction of the Scream, by Edvard Munch)

Symptoms

Torrential rains in some regions are causing massive floods while in other locales record droughts are occurring with higher frequency and severity and areal extent around the globe. Global food production is being hit hard, leading to large price increases and political instability. Areas under drought are experiencing numerous massive forest fires of incredible ferocity.

Causes

The statistics of extreme weather events have changed for the worst due to changes in the location, speed, and waviness of the jet streams which guide weather patterns and separate cold and dry northern air from warm and moist southern air. The jet streams have changed since the equator to north-pole temperature difference has decreased due to the huge temperature rise in the Arctic.

The huge temperature rise in the Arctic is due to a collapse in the area of highly reflective snow and ice, which is caused by melting. The melting is from warming from the increase of greenhouse gases from fossil fuel burning. The Arctic sea ice and spring snow cover will vanish within a few years and the weather extremes will increase at least 10x.

What can you do?

Go talk to you politicians and friends about climate change and the need to slash fossil fuel emissions. Immediately. Cut and paste my comments above and post them on facebook, send them to newspapers, and educate yourself on the science behind all the above linkages. Leave my name on or take it off and plagiarize all you want, just get this knowledge out there...

From an unmuzzled climate scientist...
Paul Beckwith, B.Eng, M.Sc. (Physics),
Ph.D. student (Climatology) and Part-time Professor,
University of Ottawa

originally posted as a comment under the CBCnews post:
Calgary braces for flooding, orders communities evacuated 

Related

- The Tornado Connection to Climate Change
- President Obama, here's a climate plan!
- Diagram of Doom
- Polar jet stream appears hugely deformed
- Ten Dangers of Global Warming (originally posted March 8, 2007)