Showing posts with label sea ice. Show all posts

Thursday, October 1, 2015

Cyclones continue to hit Northern Hemisphere

As the 2015 El Niño gets stronger, the Northern Hemisphere continues to get hit by strong winds and cyclones. The image below shows strong winds over the Arctic Ocean, as hurricane Joaquin approaches the coast of North America.


On above image, hurricane Joaquin is clocked at a speed of 79 mph (127 km/h) on October 1, 2015. NOAA warned that on that day the maximum sustained wind speed had increased to near 120 mph (195 km/h) with higher gusts.

For reference, NOAA uses four categories:
D: Tropical Depression – wind speed less than 39 mph (63 km/h)
S: Tropical Storm – wind speed between 39 mph and 73 mph (63 km/h - 118 km/h)
H: Hurricane – wind speed between 74 mph and 110 mph (118 km/h - 177 km/h)
M: Major Hurricane – wind speed greater than 110 mph (over 177 km/h)

NOAA issued the image below on September 30, 2015, warning that Hurricane Joaquin is likely to cause wind damage across a large part of the eastern coast of North America.


The NOAA animation below gives an idea of the strength of hurricane Joaquin.

[ click on image to enlarge, note that this is a 1.4 MB file that may take some time to fully load ]

Meanwhile, sea surface temperatures off the North American coast, as well as in the Arctic Ocean, are very high, as illustrated with the image on the right.

In the Arctic Ocean, the sea ice in many places is now less thick than it was in 2012, as illustrated by the image further below, showing sea ice thickness on October 7, 2012 (panel left) and a forecast for October 7, 2015 (panel right).

The water in the Arctic Ocean was already very warm this year. The main factor causing both these strong winds and the dramatic decrease in thickness of the multi-year sea ice is ocean heat, as also illustrated by the image below, showing high sea surface temperature anomalies in the Arctic as at September 30, 2015.


As the image below shows, nearly all the thick (over 3 m) multi-year sea ice has now disappeared, setting up a dangerous situation for the future that is much more dangerous than the situation was back in 2012. The thicker sea ice used to act as a buffer, consuming ocean heat in the melting process. Without thicker sea ice, ocean heat threatens to melt the sea ice from below right up to the surface, causing the entire sea ice to collapse as more open water will go hand in hand with stronger winds and waves. In case of such a collapse, sunlight that was previously reflected back into space will instead be absorbed by the water, causing rapid rise of the temperature of the water. In places such as the East Siberian Arctic Shelf, the water is on a average only 50 m deep, so warmer water is able to reach the seafloor more easily there.


The water of the Arctic Ocean is very warm, not only at the surface, but even more so underneath the surface. The danger is that strong winds will mix warm water all the way down to the seafloor, where it could destabilize sediments that can contain huge amounts of methane in the form of hydrates and free gas.

[ click on image to enlarge ]
The image on the right illustrates the impact of winds over the East Siberian Arctic Shelf on September 26, 2015.

NSIDC specialist Julienne Stroeve recently warned"In 2007 more than 3m of bottom melt was recorded by [an] ice mass balance buoy in the region, which was primarily attributed to earlier development of open water that allowed for warming of the ocean mixed layer. But perhaps some of this is also a result of ocean mixing."

As discussed in an earlier post, sea surface anomalies of over 5°C were recorded in August 2007 in the Arctic Ocean. Strong polynya activity caused more summertime open water in the Laptev Sea, in turn causing more vertical mixing of the water column during storms in late 2007 and bottom water temperatures on the mid-shelf increased by more than 3 degrees Celsius compared to the long-term mean.

The situation is dire and calls for comprehensive and effective action, as discussed at the Climate Plan.


As the 2015 El Niño gets stronger, the Northern Hemisphere continues to get hit by strong winds and cyclones. The image...
Posted by Sam Carana on Thursday, October 1, 2015

Friday, September 18, 2015

Arctic Sea Ice Collapse Threatens - Update 9

The image below shows that Arctic sea ice had reached a level of 4.45 million square kilometers on September 16, 2015 (end of dark blue line at center of image).


NSIDC has meanwhile called the 2015 minimum, but the first sentence of their post hastens to add that on September 11, Arctic sea ice reached its likely minimum for 2015,  at 4.41 million square kilometers (1.70 million square miles), putting 2015 in the fourth lowest place since satellite records began. Arctic sea ice minimum was lower only in 2012 (dotted line), 2007 (light blue line) and 2011 (orange line). Sea ice extent was 4.413 million square kilometers both on September 9, 2015, as well as on September 10 and 11, 2015.

September 9 would be early for the sea ice to reach its minimum, as a comparison with earlier years on above image illustrates. The dark blue line on above image shows that sea ice extent fell slightly on September 16, compared to the day before, and is now below the 2011 extent (orange line) for this time of the year. Over the next few days, sea ice extent may well fall somewhat further, and reach a level below the 2011 minimum, thus reaching the third lowest minimum extent since record began. This could eventuate due to winds compacting the sea ice.

More importantly, sea ice thickness is still falling, as illustrated by the image below showing the sea ice thickness on September 9 in the left panel and a forecast for thickness on September 24 in the right panel.


The image below compares sea ice thickness between September 24, 2012 (left panel) with that forecast for September 24, 2015 (right panel).


Above image illustrates why the situation in 2015 is even more threatening than it was in 2012. Only the ice that is colored light green, yellow and red is more than 3 meters thick. In 2015, ocean heat has been melting the sea ice from underneath. So, even while the currently lower temperatures of the air may have resulted in a slight increase in extent over the past week, the added ice is very thin. Ocean heat first of all goes into melting the thickest sea ice, i.e. the parts that are meters below the surface. This because the water at surface level is colder than the water underneath the surface. This explains why much of the water surface will remain covered by (very thin) ice as air temperatures are now falling (compared to air temperatures over the past few months).

The image below shows sea surface temperatures as at September 17, 2015.


In conclusion, while the sea ice appears to have survived the 2015 melting season without collapsing, the threat that this will occur in the coming years is ominous. Lack of multi-year sea ice makes that sea ice is in a very vulnerable situation. Total collapse of sea ice is therefore more likely to happen in the coming years. Every time ocean heat will arrive in the Arctic Ocean at its fullest strength in future, this heat will no longer be able to be fully absorbed by the process of melting thick sea ice, so what's left of the sea ice will melt very quickly.

There is a strengthening El Niño, while more open water increases the chance that storms will develop that will push the last remnants of the sea ice out of the Arctic Ocean, as discussed in earlier posts such as this one. Storms can also mix warm surface waters all the way down to the seafloor, as discussed in this earlier post. Cyclones that emerge with greater force due to high sea surface temperatures further increase this danger.

The big danger is that ocean heat will cause methane contained in sediments on the Arctic Ocean seafloor to be released abruptly in large quantities, triggering further methane releases spiraling into runaway warming.

The situation is dire and calls for comprehensive and effective action, as discussed in the Climate Plan.


Below is a text-only version of this post for radio.


Sea ice thickness on September 24, 2012 (left panel) compared to a forecast for September 24, 2015 (right panel). This...
Posted by Sam Carana on Friday, September 18, 2015

Tuesday, September 1, 2015

Arctic Sea Ice Collapse Threatens - Update 7

The image below shows Arctic sea ice extent, with the blue dot indicating that extent for August 30, 2015, was 4.804 million square kilometers. Satellite records shows that, at this time of the year, extent was only lower in 2007, 2011 and 2012.


There are a number of reasons why sea ice looks set to decrease dramatically over the next few weeks. On above image, extent for 2015 looks set to soon cross the lines for the years 2007 and 2011, while the sea ice today is in an even worse condition than one might conclude when looking at extent alone.

Thick sea ice is virtually absent compared to the situation in the year 2012 around this time of year, as illustrated by the image below that compares sea ice thickness on August 30, 2012 (left) with August 30, 2015 (right).


Furthermore, sea surface temperatures are very high. The North Pacific, on August 31, 2015, was about 1°C (1.8°F) warmer than it was compared to the period from 1971 to 2000, as illustrated by the Climate Reanalyzer image on the right.

As the image below shows, sea surface temperature anomalies are very high around North America, both in the Pacific Ocean and in the Atlantic Ocean.

The image below shows sea surface temperatures on August 30, 2015, indicating that a huge amount of ocean heat has accumulated in the Atlantic Ocean off the coast of North America.


The Gulf Stream is carrying much of this warm water toward the Arctic Ocean. Additionally, warm water from the Pacific Ocean is entering the Arctic Ocean through the Bering Strait.


Above image below shows sea surface temperature anomalies in the Arctic as at August 31, 2015.


There still are a few weeks to go before sea ice can be expected to reach its minimum, at around half September 2015, while sea currents will continue to carry warmer water into the Arctic Ocean for months to come.

There is a strengthening El Niño, while more open water increases the chance that storms will develop that will push the last remnants of the sea ice out of the Arctic Ocean, as discussed in earlier posts such as this one. Storms can also mix warm surface waters all the way down to the seafloor, as discussed in this earlier post. Typhoons increase this danger. The above image show three typhoons in the Pacific Ocean on 30 August, 2015, and the Climate Reanalyzer image on the right shows them on September 1, 2015.

These typhoons are headed in the direction of the Arctic. The Climate Reanalyzer forecast for September 8, 2015, below shows typhoons in the Pacific Ocean close to the Arctic Ocean, as well as strong wind over the Arctic Ocean.


The situation is dire and calls for comprehensive and effective action, as discussed in the Climate Plan.

Thick sea ice is virtually absent compared to the situation in the year 2012 around this time of year....
Posted by Sam Carana on Tuesday, September 1, 2015

Monday, August 24, 2015

Arctic Sea Ice Collapse Threatens - Update 6

The image below shows Arctic sea ice extent, with the blue dot indicating that extent for August 22, 2015, was 5.382 million square kilometers. The record shows that, at this time of the year, extent was only lower in 2007, 2011 and 2012.

There are a number of reasons why sea ice could fall dramatically over the next few weeks.

First of all, the situation today is in an even worse condition than one might conclude when looking at sea ice extent alone. The way NSIDC calculates extent is by first dividing the satellite image into a grid and then including each cell in extent that has 15% or more ice. So, if a few small and very thin pieces of ice floating in a cell happen to cover 15% of a cell, it is counted in as "sea ice".

There is quite a difference between the sea ice that was 5 meters thick north of Greenland in 2012 and the ice that is present there now. The image on the right shows the north-east corner of Greenland on the bottom left. There is almost no ice north of this point.

Thick sea ice is virtually absent compared to the situation in the year 2012 around this time of year, as illustrated by the image below that compares sea ice thickness on August 20, 2012 (left) with August 20, 2015 (right), from an earlier post.


Furthermore, sea surface temperatures are very high. The North Pacific, on August 23, 2015, was exactly 1°C (1.8°F) warmer than it was compared to the period from 1971 to 2000 (see Climate Reanalyzer image right).

As the image below shows, sea surface temperature anomalies are very high around North America. On August 23, 2015, sea surface temperature anomalies as high as 6.4°C (11.5°F) were recorded in the Bering Strait.

This is where warm waters from the Pacific Ocean are flowing into the Arctic Ocean.


The image below shows sea surface temperatures on August 22, 2015, indicating that a huge amount of ocean heat has accumulated in the Atlantic Ocean off the coast of North America.


The Gulf Stream is carrying much of this warm water toward the Arctic Ocean. On August 21, 2015, sea surface temperatures near Svalbard were as high as 17°C (62.6°F), a 12°C (21.5°F) anomaly, at the location marked by the green circle on the image below, showing sea surface temperatures in the top panel and sea surface temperature anomalies in the bottom panel.


The image below shows sea surface temperature anomalies in the Arctic as at August 23, 2015.


[ click on image to enlarge ]
There still are a few weeks to go before sea ice can be expected to reach its minimum, at around half September 2015, while sea currents will continue to carry warmer water into the Arctic Ocean for months to come.

More open water increases the chance that storms will develop that will push the last remnants of the sea ice out of the Arctic Ocean, as discussed in earlier posts such as this one, while storms can also mix warm surface waters all the way down to the seafloor, as discussed in this earlier post. The Climate Reanalyzer forecast for August 26, 2015, on the right shows strong winds both in the Bering Strait and the North Atlantic.

Typhoons increase this danger. The Climate Reanalyzer forecast for August 27, 2015, below shows a typhoon in the Pacific Ocean close to the Arctic Ocean.


The situation is dire and calls for comprehensive and effective action, as discussed in the Climate Plan.


On August 21, 2015, sea surface temperatures near Svalbard were as high as 17°C (62.6°F), a 12°C (21.5°F) anomaly, at...
Posted by Sam Carana on Monday, August 24, 2015
Tuesday, August 18, 2015

Disappearance Of Thick Arctic Sea Ice

[ view full image at facebook ]


Arctic sea ice is in a horrible state. On August 16, 2015, Arctic sea ice extent was 5.786 million square km, the smallest extent on record for this time of year except for the years 2007, 2011 and 2012, as illustrated by the image on the right.

The situation today is even worse than one might conclude when looking at sea ice extent alone. Thick sea ice is virtually absent compared to the situation in the year 2012 around this time of year, as illustrated by the image below comparing sea ice thickness on August 16, 2012 (left) with August 16, 2015 (right).


The ice used to be over 4 m thick, or over 13 ft thick, north of Greenland and the Canadian Archipelago. This thick multi-year ice has been a feature of the Arctic sea ice for over 100,000 years. It used to be there all year long, unlike the thinner ice that could melt away entirely during the melting season.

The disappearance of this thick multi-year ice is a major development. Why? Until now, the thicker multi-year sea ice used to survive the melting season, giving the sea ice strength for the next year, by acting as a buffer to absorb heat that would otherwise melt away the thinner ice. Without multi-year sea ice, the Arctic will be in a bad shape in coming years, and huge amounts of heat that would otherwise go into melting the ice will instead be warming up the Arctic Ocean, further accelerating warming of its waters.

Absence of thick sea ice makes it more prone to collapse, and this raises the question whether the sea ice could collapse soon, even this year. Sea ice works like a mirror. Without sea ice, sunlight that was previously reflected back into space, will instead be absorbed by the Arctic. Albedo changes in the Arctic alone could more than double the net radiative forcing resulting from the emissions caused by all people of the world, as calculated by Prof. Peter Wadhams back in 2012.

Furthermore, there is a danger that loss of the sea ice will weaken the currents that currently cool the bottom of the sea, where huge amounts of methane may be present in the form of free gas or hydrates in sediments. This danger is illustrated by the image below by Reg Morrison, from an earlier post.


Absence of sea ice also goes hand in hand with opportunities for storms to develop over the Arctic Ocean. Such storms could push the remaining sea ice out of the Arctic Ocean. Such storms could also mix surface heat all the way down to the seafloor, where methane could be contained in sediments.

As described in an earlier post, sea surface anomalies of over 5 degrees Celsius were recorded in August 2007 (NOAA image right). Strong polynya activity caused more summertime open water in the Laptev Sea, in turn causing more vertical mixing of the water column during storms in late 2007, as described in this study, and bottom water temperatures on the mid-shelf increased by more than 3 degrees Celsius compared to the long-term mean.

Indeed, the danger is that heat will warm up sediments under the sea, containing methane in hydrates and as free gas, causing large amounts of this methane to escape rather abruptly into the atmosphere.

The image on the right, from a study by Hovland et al., shows that hydrates can exist at the end of conduits in the sediment, formed when methane did escape from such hydrates in the past.

Heat can travel down such conduits relatively fast, warming up the hydrates and destabilizing them in the process, which can result in huge abrupt releases of methane.

Since waters can be very shallow in the Arctic, much of the methane can then rise up through these waters without getting oxidized. As the methane causes further warming in the atmosphere, this will contribute to the danger of even further methane escaping, further accelerating local warming, in a vicious cycle that can lead to catastrophic conditions well beyond the Arctic. For additional feedbacks in the Arctic, see the feedbacks page

At the same time, ocean heat is at a record high and there's an El Niño that's still gaining strength. This ocean heat is likely to reach the Arctic Ocean in full strength by October 2015, at a time when sea ice may still be at its minimum. The image below shows sea surface temperatures on August 16, 2015 (left) and anomalies (right).


How warm is the water entering the Arctic Ocean? Merely looking at sea surface temperatures could make one overlook the full extent of the predicament we are in. Ocean heat traveling underneath the sea surface can be even warmer than temperatures showing up at the surface. This is illustrated by the image below indicating that on August 16, 2015, warm water emerged at the sea surface near Svalbard with temperatures as high as 14.9°C or 58.7°F, a 9.5°C or 17.1°F anomaly.


There still is about a month to go before sea ice can be expected to reach its minimum, at around half September 2015, while sea currents will continue to carry warmer water into the Arctic Ocean for months to come.

The situation is dire and calls for comprehensive and effective action, as discussed in the Climate Plan


Thick sea ice is virtually absent compared to the situation in the year 2012 around this time of year, as illustrated by...
Posted by Sam Carana on Tuesday, August 18, 2015

Sunday, August 16, 2015

Arctic Sea Ice Collapse Threatens - Update 5

The image below shows sea surface temperatures in the Arctic as at August 15, 2015.


Below a time lapse video, covering the period from May 30 to August 15, 2015, created by Cameron Forge with daily images from NPEO Webcam 1 from the North Pole Environmental Observatory, National Science Foundation. For a drift map of the buoys, also see this page.


Below is an August 14, 2015, satellite image from Arctic.io showing that there is very little sea ice to the north east of Greenland and what is there looks to be very thin as well.


The image below shows Arctic sea ice extent, with the blue dot indicating the extent for August 14, 2015.


More will follow soon.


Sea surface temperatures in the Arctic as at August 15, 2015.http://arctic-news.blogspot.com/2015/08/arctic-sea-ice-collapse-threatens-update-5.html
Posted by Sam Carana on Sunday, August 16, 2015

Friday, August 14, 2015

Arctic Sea Ice Collapse Threatens - Update 4


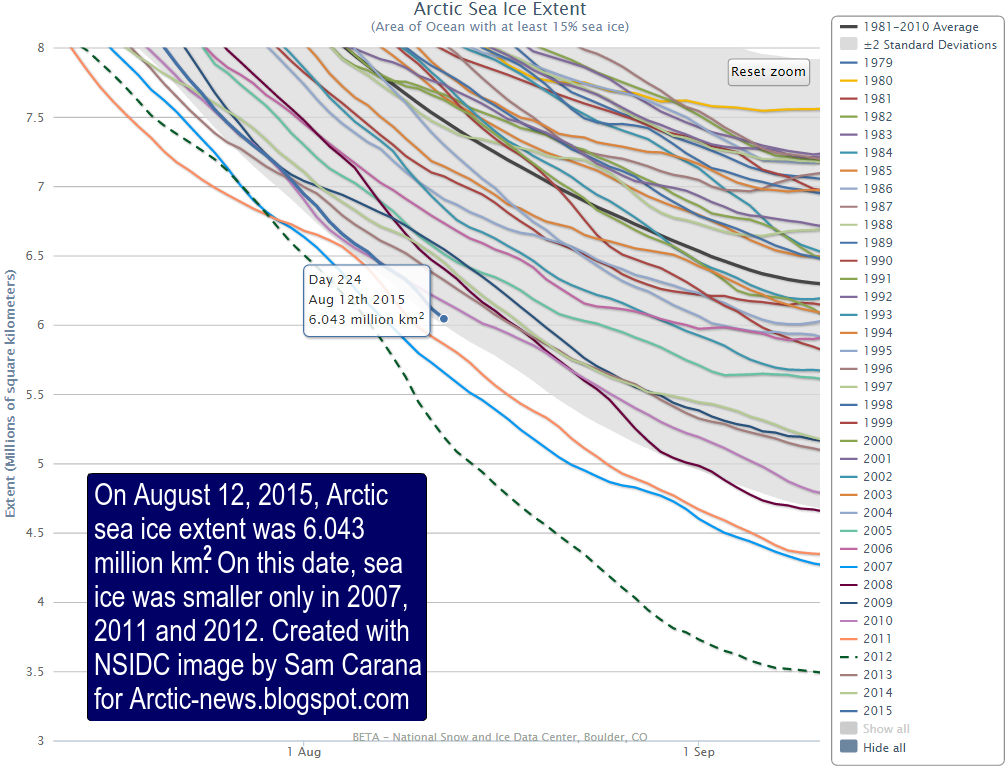
On August 12, 2015, Arctic sea ice extent was 6.043 million square km. For this date, the only years on record that sea ice extent was smaller were 2007, 2011 and 2012, as illustrated by above image.

Similarly, on August 11, 2015, Arctic sea ice area on August 11, 2015, was 3.67025 million square km (bottom end yellow line). For this date, the only years on record that sea ice area was smaller were 2007, 2011 and 2012.

So, will Arctic sea ice reach a record low this year? The situation is actually a lot worse than it appears when just looking at sea ice extent and area up until now. 

In fact, sea ice is in a horrible state. One indication of this is the almost complete absence of thick sea ice on August 12, 2015, which becomes even more clear when compared with the situation in 2012 for the same date, as illustrated by the image below. 

The absence of thick sea ice means that, in terms of volume, there is very little sea ice left to melt until the minimum volume will be reached around half September. In other words, the remaining sea ice could melt rather quickly. 


Also note the presence of water on the image below, from Web Cam 1, from the North Pole Environmental Observatory, National Science Foundation. For a drift map of the buoys, also see this page.


The image below shows sea surface temperature anomalies in the Arctic on August 13, 2015.


As discussed earlier, Greenland's dramatic losses of ice mass over the past few years and the subsequent large volumes of meltwater have affected sea surface temperatures in the North Atlantic and have caused the sea ice to be larger than it would otherwise have been in terms of extent and area.

Nonetheless, this has not halted the overall rise of ocean heat and the subsequent decline of Arctic sea ice, as illustrated by the discussion further above on sea ice thickness. Thick sea ice is shattered if not absent altogether in many places. 

Until now, the thicker multi-year sea ice used to survive the melting season, giving the sea ice strength for the next year, by acting as a buffer to absorb heat that would otherwise melt away the thinner ice. Without multi-year sea ice, the Arctic will be in a bad shape in coming years. Absence of thick sea ice makes it more prone to collapse, and this raises the question whether a collapse could occur not merely some years from now, but even this year.

Meanwhile, ocean heat is at a record high and there's an El Nino that's still gaining strength. The image below illustrates that a huge amount of ocean heat has been piling up in the Atlantic Ocean, ready to be carried into the Arctic Ocean, while large amounts of heat are also entering the Arctic Ocean from the Pacific Ocean through  the Bering Strait.

Sea surface temperatures around North America - note that the top end of the scale is 35°C or 95°F 

This ocean heat is likely to reach the Arctic Ocean in full strength by October 2015, at a time when sea ice may still be at its minimum. Absence of sea ice goes hand in hand with opportunities for storms to develop over the Arctic Ocean, which could mix surface heat all the way down to the seafloor, where methane could be contained in sediments. 

The methane situation is already very dangerous, given mean methane levels that recently reached levels as high as 1840 ppb, while much higher peak levels can occur locally, as illustrated by the image below. 
Methane levels appear to be rising by over 10 parts per billion a year at Barrow, Alaska. Worryingly, high peaks have been showing up there recently.

In conclusion, Arctic sea ice looks set to take a further battering over the next few weeks and could end up at a record low around half September 2015. If things get really bad, sea ice collapse could occur and the remaining pieces of sea ice could be driven out of the Arctic Ocean altogether by storms, resulting in a blue ocean event as early as September this year.

The situation is dire and calls for comprehensive and effective action, as discussed at the Climate Plan.


On August 11, 2015, Arctic sea ice area on August 11, 2015, was 3.67025 million square km (bottom end yellow line). For...
Posted by Sam Carana on Friday, August 14, 2015

Sunday, August 9, 2015

The Methane Monster


At no time in the past did humans exist under conditions that we are facing now, no matter how far back you go in history.

Global mean methane levels as high as 1840 parts per billion were recorded on August 4, 2015. This is the highest mean level since records began and this new record is likely to be superseded by even higher levels soon.

The carbon dioxide that is released now will only reach its peak impact a decade from now. Methane's high immediate impact makes it more important than carbon dioxide emissions in driving the rate of global warming over the coming decade.

The Pacific Ocean is very warm at the moment. Warm water flows from the Pacific Ocean through the Bering Strait into the Arctic Ocean. Sea surface temperatures in the Bering Strait were as high as 20.5°C (or 69.1°F) on August 4, 2015. That is 8.7°C (or 15.6°F) warmer than the water used to be. Sea surface temperatures as high as 11.8°C (53.2°F) were recorded in between Greenland and Svalbard on August 7, 2015, an anomaly of 8.5°C (15.3°F).

[ click on image to enlarge ]
The danger is that further warming will cause collapse of the sea ice, which in turn will lead to even more rapid warming of the Arctic Ocean, while the presence of more open water will also increase the opportunity for powerful storms to develop that can mix high sea surface temperatures all the way down to the seafloor, resulting in destabilization of sediments and triggering releases of methane that can be contained in such sediments in huge amounts.

Methane releases from the seafloor of the Arctic ocean threaten to cause rapid local warming that in turn will trigger further methane releases, in a vicious cycle of runway warming that could destroy habitat for humans within decades.

[ click on image to enlarge ]
The situation is dire and calls for comprehensive and effective action as discussed at the Climate Plan at the Arctic-News Blog.


References

-  Sea surface temperatures in the Bering Strait on August 4, 2015. 

- Sea surface temperatures in between Greenland and Svalbard on August 7, 2015.
http://earth.nullschool.net/#2015/08/07/0000Z/ocean/surface/currents/overlay=sea_surface_temp_anomaly/orthographic=18.75,79.02,3000

- Maximum warming occurs about one decade after a carbon dioxide emission, by Katharine L Ricke and Ken Caldeira (2014)
http://iopscience.iop.org/1748-9326/9/12/124002/article

- Methane's Global Warming Potential
http://arctic-news.blogspot.com/p/faq.html#13


THE METHANE MONSTER - by Sam Carana At no time in the past did humans exist under conditions that we are facing now,...
Posted by Sam Carana on Sunday, August 9, 2015