The image below illustrates the dramatic fall in sea ice thickness (in m) in the Beaufort Sea over the past month. The left panel shows sea ice thickness on May 29, 2015, and the panel on the right shows sea ice thickness on June 29, 2015.
The 30-day animation below further illustrates this dramatic fall in sea ice thickness (from June 8-29, with forecast up to July 7, 2015).
Another perspective is sea ice concentration. The image below shows the high concentration back on May 1, 2015.
The 30-day animation below shows the dramatic fall in sea ice concentration (from June 8-29, with forecast up to July 7, 2015).
Below an interview by Judy Sole with Professor Peter Wadhams, held May 15, 2015, and entitled 'Our time is running out - The Arctic sea ice is going!'
Meanwhile, very high temperatures keep showing up within the Arctic Circle. On July 1, 2015, a temperature of 36°C (96.8°F) was reached near the Kolyma River that ends in the East Siberian Sea, as illustrated by the images below (green circle).
The image below also shows the location where this high temperature was reached (red marker), as well as the depth of the seabed and the Gakkel Ridge that runs in between the northern tip of Greenland and the Laptev Sea.
Dramatic Sea Ice Decline In Beaufort Sea in June 2015 http://arctic-news.blogspot.com/2015/06/dramatic-sea-ice-decline-in-beaufort-sea-in-june-2015.html Posted by Sam Carana on Tuesday, June 30, 2015
The persistent character of these very high methane concentrations over the Arctic Ocean indicates that methane has started to erupt from clathrates under the seabed, triggered by very warm water reaching the bottom of the Arctic Ocean.
Methane eruptions from hydrates in sediments under the Arctic Ocean helped mean methane levels reach new records, with mean global methane readings as high as 1835 parts per billion recorded at several altitudes on August 17, 2014.
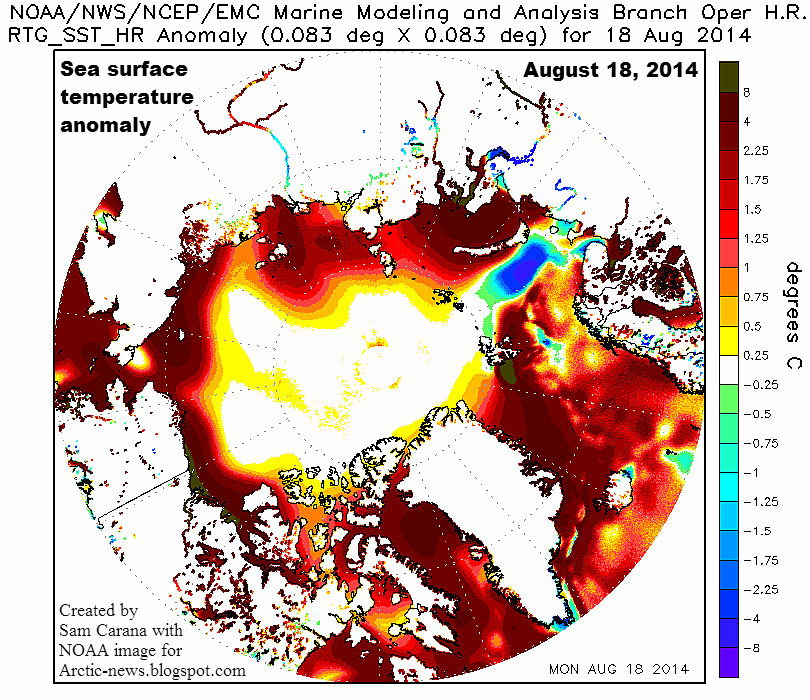
The very high sea surface temperature anomalies that show up on above image give an idea of the inflow of warm water from the Pacific Ocean through the Bering Strait. This is further highlighted by the combination image below.
[ click on image to enlarge ]
The situation is dire and calls for comprehensive and effective action, as discussed at the Climate Plan blog.
The image below shows methane readings of 1950 ppb and higher, as at November 15, 2013, p.m., close to sea level. The image also shows sea ice concentration, as at November 7, 2013, i.e. the most recent SSMIS data available on methanetracker.
[ click on image to enlarge ]
The image shows huge amounts of methane rising from the seafloor along the fault line that crosses the Arctic Ocean. The image also shows huge amounts of methane over thinner parts of the sea ice. To illustrate this further, the November 15, 2013, Naval Research Laboratory image is added below, showing ice thickness based on the most recent sea ice data.
The image below zooms in on the large amounts of methane, stretching out all the way from the Beaufort Sea to Baffin Bay.
[ click on image to enlarge ]
Above image illustrates that methane does show up prominently where the sea ice is thin, confirming earlier conclusions that the sea ice acts as a shield, a seal if you like, holding the methane in place and thus giving microbes the time needed to decompose the methane while it is held underneath the ice.
This spells bad news, because it implies that, as the sea ice thins, more methane will be able to enter the atmosphere and contribute to warming that is already accelerating in the Arctic.
As discussed in a recent post, methane is rising from the seafloor of the Arctic Ocean due to destabilization of sediments that hold huge amounts of methane in the form of free gas and hydrates. This destabilization is in part due to warm water flowing in the Arctic Ocean along the Gulf Stream. Record warm water was present off the coast of North America in July 2013, and this warm water took some time to reach the Arctic Ocean, as shown on the image below, from that earlier post.
Water in the currents that are returning water to the Atlantic Ocean north of Canada is typically cold, as indicated by the blue color on the image below. So, while it is possible that the water was still sufficiently warm to cause methane releases from the seabed in the Beafort Sea and in Baffin Bay, in the northern parts of Canada, it seems more likely that the methane originated from areas along the fault line that crosses the Arctic Ocean and that the methane traveled - underneath the sea ice - with these currents all the way to the edges of the sea ice where the ice is sufficiently fractured and thin to allow methane to rise to the surface.
This seems confirmed by recent sea surface temperature data, as pictured below.
As above image shows, sea surface temperature anomalies (in orange, red and brown) are still showing up prominently along many parts of the Gulf Stream, all the way into the Arctic Ocean, where anomalies of more than 8 degrees Celcius have been recorded for some time now. At the same time, colder water (in green and blue) is flowing back into the Atlantic Ocean from the Arctic Ocean, along the edges of Greenland and further south. Colder currents typically flow at greater depth, but the above image also shows colder waters emerging at sea surface level, especially in areas somewhat off the coasts of Newfoundland and Nova Scotia, effectively preventing some warm water from traveling along the Gulf Stream to the Arctic Ocean.
Why are the currents that are flowing out of the Arctic Ocean into the Atlantic Ocean so strong at the moment? Powerful winds have speeded up these currents, as illustrated by the 30-days Naval Research Laboratory animation below, which also includes a 7-days forecast from November 15, 2013.
One of the feedbacks of accelerated warming in the Arctic is stronger winds and a huge amount of sea ice is currently flowing into the Atlantic Ocean, partly due to these strong winds. Similarly, the Naval Research Laboratory animation below shows huge amounts of sea ice, often very thick ice, being pushed into the Atlantic Ocean.
Last but not least, the youtube video below, Arctic Death Spiral and the Methane Time Bomb, shows some of the most powerful video footage on climate change, highlighting the danger that methane will continue to rise from the seafloor of the Arctic Ocean in ever greater quantities, resulting in a wipe-out of civilization, extinctions at massive scale and devastation of the planet as we know it.
The Arctic Ocean is turning red, as sea surface temperatures (SST) rise. The NOAA maps below, dated August 12, 2013, show sea surface temperature anomalies across the Arctic Ocean of up to 5°C (9°F). Virtually all areas were the sea ice has disappeared are now colored scarlet red.
[ click on image to enlarge ]
The (updated) animation below shows SST anomalies from June 3 to August 26, 2013.
Locally, the situation can be even worse. The NOAA map below, dated August 13, 2013, shows that areas where the sea ice has disappeared in the Arctic Ocean can be exposed to sea surface temperature anomalies higher than 8°C (14.4°F).
[ click on image to enlarge ]
These anomalies are very high, even when compared to some of the recent years, when the decline of sea ice extent didn't look as bad as it appears now.
Many people may only look at the sea ice, assuming that things are fine as long as there is no dramatic decrease in sea ice area or extent (see Cryosphere Today image right).
However, there are many other things to consider, as described in the earlier post Cyclone raging over thin ice. Most importantly, sea surface temperature anomalies this high are very alarming!
For comparison, the image below shows August sea surface temperature anomalies in 2007, 2010 and 1011.
These high sea surface temperature anomalies are firstly caused by higher sea and air temperatures as a result of global warming. Additionally, there are many feedbacks that accelerate the temperature rise in the Arctic, as discussed at the post Diagram of Doom. Local conditions can further accelerate the temperature rise in specific areas, such as where warm water from rivers flows into the Arctic Ocean.
As the map below shows, a number of large rivers end in the Kara Sea, where high temperatures have been recorded for some time.
Another large river is the Mackenzie River, which ends in the Beaufort Sea, where sea surface temperatures of about 20°C (68°F) are currently recorded, as the image below illustrates.
Similarly, the NOAA image below shows that sea surface temperatures of up to 18°C (64.4°F) were recorded in the Bering Strait on August 12, 2013.
Note that the melting season still has quite a while to go. Arctic sea ice volume minimum is typically reached around halfway into September, which is more than one month away. On September 12-13, 2011, temperatures of 6-7°C were reached over East Siberian Arctic Shelf, and up to 9°C along the coast of Alaska.
The danger of this situation is that this dramatic rise in temperature anomalies will not remain restricted to surface waters, but that heat will penetrate the seabed which can contain huge amounts of methane in the form of hydrates and free gas in sediments.
Submarine pingoes: Indicators of shallow gas hydrates in a pockmark at Nyegga, Norwegian Sea - Hovland et al., Marine Geology 228 (2006) 15–23
At the moment, a cyclone is raging over the Arctic Ocean, and this causes warm surface waters to be mixed down, in many places all the way down to the seabed, due to the shallow nature of many of the seas in the Arctic Ocean.
As shown on the image right and also described at the FAQ page, there can be all kinds of fractures in the sediment, while there can also be conduits where methane has escaped earlier from hydrates, allowing heat to penetrate deep into the sediment and causing methane to escape.
Methane is kept stable inside hydrates as long as the temperature remains low. Since methane expand some 160 times in volume, compared to its compressed frozen state inside the hydrate, warming of even a small part of a hydrate can cause destabilization across the entire hydrate. It may take only a small rise in temperature of a single conduit in the sediment to set off a large abrupt release of methane, which subsequently threatens to cause further releases elsewhere in the Arctic Ocean and trigger runaway global warming, as described at the methane hydrates blog.