Showing posts with label feedbacks. Show all posts

Saturday, September 5, 2015

Methane Monster II ~ Demise of the Arctic


Presentation by Jennifer Hynes on runaway feedbacks in the Arctic and the resulting threat of near-term human extinction. At youtube.com/watch?t=309&v=L19JBY0kNmo


There are links to the transcript and to the complete set of slides of the presentation at Jennifer Hynes' blog.

In case you are looking for the earlier presentation by Jennifer Hynes, called 'The Arctic Methane Monster's Rapid Rise', it's at youtube.com/watch?v=a9PshoYtoxo and is also displayed below.


Methane Monster II ~ Demise of the Arctic by Jennifer Hynes http://arctic-news.blogspot.com/2015/09/methane-monster-2-demise-of-the-arctic.html
Posted by Sam Carana on Saturday, September 5, 2015

Tuesday, August 18, 2015

Disappearance Of Thick Arctic Sea Ice

[ view full image at facebook ]


Arctic sea ice is in a horrible state. On August 16, 2015, Arctic sea ice extent was 5.786 million square km, the smallest extent on record for this time of year except for the years 2007, 2011 and 2012, as illustrated by the image on the right.

The situation today is even worse than one might conclude when looking at sea ice extent alone. Thick sea ice is virtually absent compared to the situation in the year 2012 around this time of year, as illustrated by the image below comparing sea ice thickness on August 16, 2012 (left) with August 16, 2015 (right).


The ice used to be over 4 m thick, or over 13 ft thick, north of Greenland and the Canadian Archipelago. This thick multi-year ice has been a feature of the Arctic sea ice for over 100,000 years. It used to be there all year long, unlike the thinner ice that could melt away entirely during the melting season.

The disappearance of this thick multi-year ice is a major development. Why? Until now, the thicker multi-year sea ice used to survive the melting season, giving the sea ice strength for the next year, by acting as a buffer to absorb heat that would otherwise melt away the thinner ice. Without multi-year sea ice, the Arctic will be in a bad shape in coming years, and huge amounts of heat that would otherwise go into melting the ice will instead be warming up the Arctic Ocean, further accelerating warming of its waters.

Absence of thick sea ice makes it more prone to collapse, and this raises the question whether the sea ice could collapse soon, even this year. Sea ice works like a mirror. Without sea ice, sunlight that was previously reflected back into space, will instead be absorbed by the Arctic. Albedo changes in the Arctic alone could more than double the net radiative forcing resulting from the emissions caused by all people of the world, as calculated by Prof. Peter Wadhams back in 2012.

Furthermore, there is a danger that loss of the sea ice will weaken the currents that currently cool the bottom of the sea, where huge amounts of methane may be present in the form of free gas or hydrates in sediments. This danger is illustrated by the image below by Reg Morrison, from an earlier post.


Absence of sea ice also goes hand in hand with opportunities for storms to develop over the Arctic Ocean. Such storms could push the remaining sea ice out of the Arctic Ocean. Such storms could also mix surface heat all the way down to the seafloor, where methane could be contained in sediments.

As described in an earlier post, sea surface anomalies of over 5 degrees Celsius were recorded in August 2007 (NOAA image right). Strong polynya activity caused more summertime open water in the Laptev Sea, in turn causing more vertical mixing of the water column during storms in late 2007, as described in this study, and bottom water temperatures on the mid-shelf increased by more than 3 degrees Celsius compared to the long-term mean.

Indeed, the danger is that heat will warm up sediments under the sea, containing methane in hydrates and as free gas, causing large amounts of this methane to escape rather abruptly into the atmosphere.

The image on the right, from a study by Hovland et al., shows that hydrates can exist at the end of conduits in the sediment, formed when methane did escape from such hydrates in the past.

Heat can travel down such conduits relatively fast, warming up the hydrates and destabilizing them in the process, which can result in huge abrupt releases of methane.

Since waters can be very shallow in the Arctic, much of the methane can then rise up through these waters without getting oxidized. As the methane causes further warming in the atmosphere, this will contribute to the danger of even further methane escaping, further accelerating local warming, in a vicious cycle that can lead to catastrophic conditions well beyond the Arctic. For additional feedbacks in the Arctic, see the feedbacks page

At the same time, ocean heat is at a record high and there's an El Niño that's still gaining strength. This ocean heat is likely to reach the Arctic Ocean in full strength by October 2015, at a time when sea ice may still be at its minimum. The image below shows sea surface temperatures on August 16, 2015 (left) and anomalies (right).


How warm is the water entering the Arctic Ocean? Merely looking at sea surface temperatures could make one overlook the full extent of the predicament we are in. Ocean heat traveling underneath the sea surface can be even warmer than temperatures showing up at the surface. This is illustrated by the image below indicating that on August 16, 2015, warm water emerged at the sea surface near Svalbard with temperatures as high as 14.9°C or 58.7°F, a 9.5°C or 17.1°F anomaly.


There still is about a month to go before sea ice can be expected to reach its minimum, at around half September 2015, while sea currents will continue to carry warmer water into the Arctic Ocean for months to come.

The situation is dire and calls for comprehensive and effective action, as discussed in the Climate Plan


Thick sea ice is virtually absent compared to the situation in the year 2012 around this time of year, as illustrated by...
Posted by Sam Carana on Tuesday, August 18, 2015

Thursday, April 23, 2015

It's time to 'Do the math' again

By David Spratt

Have we gone mad? A new report released today explains why contemporary climate change policy-making should be characterised as increasingly delusional.

As the deadline approaches for submissions to the Australian government's climate targets process, there is a flurry of submissions and reports from advocacy groups and the Climate Change Authority.

Most of these reports are based on the twin propositions that two degrees Celsius (2°C) of global warming is an appropriate policy target, and that there is a significant carbon budget and an amount of "burnable carbon" for this target, and hence a scientifically-based escalating ladder of emission-reduction targets stretching to mid-century and beyond.

A survey of the relevant scientific literature by David Spratt, "Recount: It's time to 'Do the math' again", published today by Breakthrough concludes that the evidence does not support either of these propositions.

The catastrophic and irreversible consequences of 2°C of warming demand a strong risk-management approach, with a low rate of failure. We should not take risks with the climate that we would not take with civil infrastructure.

There is no carbon budget available if 2°C is considered a cap or upper boundary as per the Copenhagen Accord, rather than a hit-or-miss target which can be significantly exceeded; or if a low risk of exceeding 2°C is required; or if positive feedbacks such as permafrost and other carbon store losses are taken into account.

Effective policy making can only be based on recognising that climate change is already dangerous, and we have no carbon budget left to divide up. Big tipping-point events irreversible on human time scales such as in West Antarctica and large-scale positive feedbacks are already occurring at less than 1°C of warming. It is clear that 2°C of climate warming is not a safe cap.

In reality, 2°C is the boundary between dangerous and very dangerous climate change and 1°C warmer than human civilisation has ever experienced.

In the lead up to the forthcoming Paris talks, policy makers through their willful neglect of the evidence are in effect normalising a 2.5–3°C global warming target.

This evidence in "Recount: It's time to 'Do the math' again" demonstrates that action is necessary at a faster pace than most policy makers conceive is possible.


Related

- It's time to 'Do the math' again
http://www.climatecodered.org/2015/04/its-time-to-do-math-again.html

- RECOUNT - It's time to 'Do the math' again
http://media.wix.com/ugd/148cb0_938b5512abfa4d4e965ec8cc292893f7.pdf

- Two degrees of warming closer than you may think
http://arctic-news.blogspot.com/2015/02/two-degrees-of-warming-closer-than-you-may-think.html

- The real budgetary emergency and the myth of "burnable carbon"
http://arctic-news.blogspot.com/2014/05/the-real-budgetary-emergency-and-the-myth-of-burnable-carbon.html

It's time to 'Do the math' again | by David Spratt http://arctic-news.blogspot.com/2015/04/its-time-to-do-math-again.html

Posted by Sam Carana on Thursday, April 23, 2015

Tuesday, February 3, 2015

Watch where the wind blows

The Arctic looks set to be pummeled by strong winds on February 5, 2015, as shown by the Climate Reanalyzer forecast below.


The video below, based on Climate Reanalyzer images, watch the situation unfold over a period of 9 days


Strong winds can increase the transport of warm water into the Arctic Ocean by the Gulf Stream. The video shows strong winds repeatedly developing off the North American east coast and moving along the path of the Gulf Stream, all the way into the Arctic Ocean, all in a matter of days.

Emissions are causing greater warming of the Gulf Stream and the Arctic. As a result, there is less temperature difference between the equator and the Arctic, slowing down the speed at which the jet streams circumnavigate the globe, while the jets can also become wavier, which in turn can cause extreme weather events.

In this case, what fuels these winds is the temperature difference between an area off the east coast of North America where temperatures are much higher than they used to be on the one hand, and an area in Siberia where temperatures are extremely low on the other hand. Wind flows from a warm area to a cold area, and the greater the temperature difference, the stronger the wind will blow.

The image below shows that, on February 3rd, 2015, a sea surface temperature of 21°C (69.8°F) was recorded off the east coast of North America (green circle), which constitutes a 12°C (21.6°F) anomaly. Anomalies as high as 12°C were also recorded on February 4, 2015.

click on image to enlarge
Changes to the jet streams can thus fuel strong winds, and such winds can bring warmer air into the atmosphere over the Arctic Ocean. On February 5, 2015, surface temperatures over a large part of the Arctic Ocean were more than 20°C (36°F) warmer compared to what they were from 1985 to 1996.


Extreme weather events, as a result of changes to the jet streams and polar vortex, are depicted as feedback #19 in the diagram below, while storms that bring warmer air into the atmosphere over the Arctic Ocean are depicted as feedback #5,

Besides increasing the transport of warm water into the Arctic Ocean and bringing warmer air into the atmosphere over the Arctic Ocean, strong winds can also break up the sea ice by sheer brute force of the waves caused by the wind.

Waves as high as 10.61 m (34.81 ft) were recorded south of Greenland on February 4, 2015, while waves as high as 7.05 m (23.13 ft) were recorded on the edge of the Arctic sea ice (east of Svalbard) on February 5, 2015, as shown on the combination image below.


Waves that break up the sea ice into smaller pieces can speed up melting, especially in summer. More wind also means more water evaporation, and warmer air holds more water vapor, so this can result in huge rainstorms that can rapidly devastate the integrity of the ice. Strong winds thus constitute a feedback that can result in more open waters in the Arctic Ocean (feedback #6 on the diagram below).

Furthermore, strong winds can speed up the currents that will eventually move sea ice out of the Arctic Ocean into the Atlantic Ocean (feedback #7). Wavy waters catch more sunlight than still water (feedback #8). Decline of the Arctic snow and ice cover results in more sunlight being absorbed by the Arctic, thus further heating up the water of the Arctic ocean (feedback #1).

The dual image below, with images from Climate Reanalyzer, shows high sea surface temperatures around North America and at the edges of the Arctic sea ice. This contributes to surface temperatures that are 20°C (36 °F) higher than what they used to be in Eastern Siberia. At the same time, temperatures on land elsewhere in Siberia, on the North Pole and in parts of Canada and Greenland can go down to 40 degrees below zero.


Accelerated warming of the Arctic is changing the jet streams, in turn contributing to the likelyhood that such strong winds will hit the Arctic. The high temperature difference between the hot spot off the North American east coast and the cold spot over Siberia fuels such strong winds. The dual images below show the jet stream's elongated path over Greenland. Accordingly, temperature anomalies in Greenland are reaching the top end of the scale.


The big danger is that such strong winds will warm up the Arctic Ocean and cause huge amounts of methane to erupt from its seafloor.

The image below shows that methane levels as high as 2503 ppb were recorded on January 31, 2015.


Such methane eruptions constitute yet another feedback that further contributes to warming in the Arctic. For more feedbacks, see the image below.

from:  climateplan.blogspot.com/p/feedbacks.html

The situation is dire and calls for comprehensive and effective action, as discussed at the Climate Plan blog.


Sunday, November 30, 2014

Another Heatwave Hits Arctic

As parts of Canada, Greenland and Russia are hit by -40 degrees temperatures (anomalies at the bottom end of the scale), parts of the Arctic are experiencing temperatures above freezing (anomalies at the top end of the scale), as illustrated by the image below.

[ click on image to enlarge ]
Temperatures in the Arctic are much higher than they used to be and this situation further accelerates warming in the Arctic, due to a number of feedbacks.

One such feedbacks has been coined the ‘open doors feedback’. Indeed, the situation is much like leaving the fridge door open. This allows cold air to more easily move out of the fridge, i.e. the Arctic, resulting in the cold temperatures over North America that have received extensive news coverage in the media. At the same time, warm air can move more easily into the fridge, i.e. the Arctic, and this is one of the reasons why the Arctic is hit by temperatures that are so much higher than what used to be normal.

The situation has been described in a number of earlier posts such as this one, as well in a recent interview with Jennifer Francis. As the Arctic warms more rapidly than the rest of the world, there's less temperature difference between the Arctic and the equator, resulting in the jet stream going around the globe at a lower speed with more elongated loops.

The left chart on above image shows such an elongated loop going north along the east coast of Greenland, then bending before Scandinavia and moving over the north of Greenland, then going around the North Pole and moving back to Scandinavia. This loop is not very visible on the chart, because the jet stream moves faster along straight tracks, and this chart highlights wind speed more than it highlights the path of the jet stream. Yet, the shape of this loop is very important, as it traps warmer air north of Greenland.

BTW, a weaker jet stream also elevates the chance of heat waves elsewhere, which can indirectly warm up the Arctic. Examples of this are heat waves over the Gulf Stream as it crosses the Atlantic Ocean, resulting in warmer water being carried into the Arctic Ocean, and heat waves over Siberia and North America, resulting in warming up of rivers that end in the Arctic Ocean.

Anyway, to get back to the current heatwave, there are a number of reasons why temperatures in the Arctic are so high at the moment. One of the biggest reasons is ocean heat, which has reached very high levels, especially in the North Atlantic, while the Gulf Stream keeps transporting warmer water from the North Atlantic into the Arctic Ocean (i.e. water that is warmer than the water in the Arctic Ocean). This warms up the seafloor of the Arctic Ocean, resulting in methane erupting from the seafloor, with a strong immediate local warming impact in the Arctic, thus further accelerating warming in the Arctic in another one of these self-reinforcing feedback loops, as pictured in the image below.


Further feedbacks that accelerate warming in the Arctic are discussed at the feedbacks page.

Without effective and comprehensive action, these feedbacks threaten to lead to runaway warming, i.e. abrupt climate change causing mass death and destruction, and resulting in extinction at massive scale, as depicted in the image below and as described in this earlier post.


In conclusion, the situation is dire and calls for comprehensive and effective action, as discussed at the Climate Plan blog.


Thursday, November 20, 2014

Ocean Temperature Rise Continues


Ocean Temperature Rise

Of all the excess heat that results from people's emissions, 93.4% goes into oceans. Accordingly, the temperature of oceans has risen substantially.

NOAA analysis shows that the most recent 12-month period, November 2013–October 2014, broke the record (set just last month) for the all-time warmest 12-month period in the 135-year period of record. The global oceans were the warmest on record for October. For January–October, the average global sea surface temperature was also record high.


The danger is that ocean temperatures will continue to rise, especially in the North Atlantic, and that the Gulf Stream will keep carrying ever warmer water from the North Atlantic into the Arctic Ocean, threatening to unleash huge methane eruptions from the Arctic Ocean's seafloor, in turn causing even higher temperatures and more extreme weather events, wildfires, etc.


High Methane Levels

High methane levels were recorded over the Arctic Ocean in October, as discussed in this earlier post, and were sustained in November, as discussed in this post. Methane levels as high as 2717 ppb were recorded on November 16, 2014, p.m, by the MetOp-1 satellite at 469 mb (i.e. 19,820 ft or 6,041 m altitude), as the image below shows.

Methane levels as high as 2549 ppb were recorded on November 19, 2014, p.m, by the MetOp-2 satellite at 586 mb (i.e. 14,385 ft or 4,384 m altitude), as the image below shows.

Above image further confirms earlier indications that these high methane levels do indeed result from large methane eruptions from the seafloor of the Arctic Ocean.

Greenhouse gas levels in general are very high over the Arctic, as earlier discussed in a recent post and as illustrated by the image below, showing carbon dioxide levels as high as 420 ppm at high latitudes, while the global mean was 403 ppm, on November 19, 2014, p.m., at 945 mb (i.e. 1,916 ft or 584 m altitude).


As said, sustained instances of large abrupt methane eruptions from the seafloor of the Arctic Ocean threaten to strongly accelerate warming in the Arctic even further, in turn resulting in ever more methane being released, as illustrated in the image below, from an earlier post.


Self-reinforcing Feedback Loops


Such methane eruptions are part of a number of self-reinforcing feedback loops that can strongly accelerate warming in the Arctic. Above image, from an earlier post, illustrates two such feedbacks, i.e. albedo changes due to snow and ice demise, and methane releases. Further feedbacks are described in this post and this post, and in the image below.

For a discussion of these and further feedbacks, see this page at the Climate Plan blog 
The threat is that such rapid temperature rises will appear at first in hotspots over the Arctic and eventually around the globe, while also resulting in huge temperature swings that could result in depletion of supply of food and fresh water, as further illustrated by the above image, from an earlier post, and the image below, from another earlier post.
[ click on image at original post to enlarge ]


IPCC warnings not strong enough


In above paragraph, the IPCC warns about the risk of methane eruptions from the seafloor of the Arctic Ocean further accelerating global warming. While the IPCC does model for a temperature rise that could exceed 12 degrees Celsius in a 'business as usual' scenario (i.e. without action taken), the IPCC does not anticipate that such a rise could occur before the year 2250, as illustrated by the image below.


The situation could be much worse than foreseen by the IPCC, due to a number of reasons, including:
  1. The non-linear way feedbacks can hugely increase temperature rises.
  2.  The IPCC's underestimation of the amount of methane contained in sediments under the Arctic Ocean and prone to be released as temperatures rise. Shakhova et al. estimate the accumulated methane potential for the Eastern Siberian Arctic Shelf (ESAS) alone as follows:
    - organic carbon in permafrost of about 500 Gt;
    - about 1000 Gt in hydrate deposits; and
    - about 700 Gt in free gas beneath the gas hydrate stability zone.
    Back in 2008, Shakhova et al. considered release of up to 50 Gt of predicted amount of hydrate storage as highly possible for abrupt release at any time.
    Furthermore, mantel methane could add to our predicament, as discussed in an earlier post.
  3. Back in 2002, Malcolm Light already warned that seismic events could trigger destabilization of methane hydrates. Furthermore, huge temperature swings can combine with pressure swings and storms, and with swings between expansion and contraction of soil and ice, resulting in severe shocks to ecosystems, as described in an earlier post
  4. The IPCC's ignoring of large methane eruptions from the seafloor of the Arctic Oceans and the resulting growth of mean global methane levels at higher altitudes, as discussed in an earlier post.
Steven Sherwood et al. wrote back in 2010 that peak heat stress, quantified by wet bulb temperature, across diverse climates today never exceeds 31 degrees Celsius (see also this update). Some may believe that this doesn't apply to the Arctic and the higher altitudes in mountain regions. However, at the June Solstice the amount of solar radiation received in the Arctic is higher than anywhere else on Earth, An increased occurence and intensity of heatwaves could expose large areas of the Arctic and mountain regions to sustained heatwaves exceeding peak heat stress temperatures. In addition, ocean acidification and oxygen depletion in the Arctic Ocean would make it hard for fish, seals, polar bears and further wildlife to survive. Furthermore, the short growth season combined with a long, cold winter limits vegetation in the Arctic, while ecosystems are also becoming increasingly exposed to wild weather swings and wildfires.


Risk Assessment

When taking above points into acount, an absence of action seems to guarantee human extinction by the year 2050. Little action will be ‘too little, too late’ and will merely delay human extinction by a few years, as illustrated by the graph below.


The graph identifies the years 2030 and 2040 as critical. Beyond the year 2030, the risk that humans will go extrinct grows larger than 1% in the absence of action. By the year 2040, the risk of human extinction will have increased substantially, especially if no action will have been taken, but also if too little action will have been taken up to 2040, while even with the best possible programs put in place by the year 2015, there will be a 2% risk of human extinction by 2040, e.g. due to war over what action to take, or due to political opposition or errors making such programs ineffective or even counter-productive.

In conclusion, it is highly likely that the risk of human extinction already now is intolerably high and rising with every moment passing with little no action taken to reduce the risk. This calls for comprehensive and effective action, as further discussed at the Climate Plan blog.


References

- Intergovernmental Panel on Climate Change (IPCC) WGI Fifth Assessment Report (AR5), Final Draft (7 June 2013), page 168.
http://www.climatechange2013.org/images/uploads/WGIAR5_WGI-12Doc2b_FinalDraft_Chapter02.pdf

- Intergovernmental Panel on Climate Change (IPCC) WGI Fifth Assessment Report (AR5), Final Draft (7 June 2013), Figure 12.5.
http://www.climatechange2013.org/images/uploads/WGIAR5_WGI-12Doc2b_FinalDraft_Chapter12.pdf

- An adaptability limit to climate change due to heat stress - by Steven C. Sherwood & Matthew Huber
http://www.pnas.org/content/early/2010/04/26/0913352107.full.pdf

- Ocean Temperature Rise - by Sam Carana
http://arctic-news.blogspot.com/2014/10/ocean-temperature-rise.html

- Methane release from the East Siberian Arctic Shelf and the Potential for Abrupt Climate Change - by Natalia Shakhova & Igor Semiletov
http://symposium2010.serdp-estcp.org/content/download/8914/107496/version/3/file/1A_Shakhova_Final.pdf

- Anomalies of methane in the atmosphere over the East Siberian shelf: Is there any sign of methane leakage from shallow shelf hydrates? - by Shakhova, Semiletov, Salyuk & Kosmach  http://www.cosis.net/abstracts/EGU2008/01526/EGU2008-A-01526.pdf

- Mantle Methane - by Malcolm Light
http://arctic-news.blogspot.com/2014/02/mantle-methane.html

- Evidence linking Arctic amplification to extreme weather in mid-latitudes - by Jennifer A. Francis and S.J. Vavrus, in: Geophysical Research Letters 39 (6):. doi:10.1029/2012GL051000
http://onlinelibrary.wiley.com/doi/10.1029/2012GL051000/abstract

- Near-Term Human Extinction - by Sam Carana
http://arctic-news.blogspot.com/2014/04/near-term-human-extinction.html

- Warm waters threaten to trigger huge methane eruptions from Arctic Ocean seafloor - by Sam Carana
http://arctic-news.blogspot.com/2014/08/warm-waters-threaten-to-trigger-huge-methane-releases-from-arctic-ocean-seafloor.html

- How many deaths could result from failure to act on climate change? - by sam Carana
http://arctic-news.blogspot.com/2014/05/how-many-deaths-could-result-from-failure-to-act-on-climate-change.html

- Methane linked to Seismic Activity in the Arctic - by Malcolm P. Light & Sam Carana
http://arctic-news.blogspot.com/p/seismic-activity.html

- Wild Weather Swings - by Sam Carana
http://arctic-news.blogspot.com/2014/10/wild-weather-swings.html

- Four Hiroshima bombs a second: how we imagine climate change - by Sam Carana
http://arctic-news.blogspot.com/2013/08/four-hiroshima-bombs-second-how-we-imagine-climate-change.html

- Polar jet stream appears hugely deformed
http://arctic-news.blogspot.com/2012/12/polar-jet-stream-appears-hugely-deformed.html

- Near-Term Human Extinction
http://arctic-news.blogspot.com/2014/04/near-term-human-extinction.html


Tuesday, August 26, 2014

Very warm waters are invading the Arctic Ocean

Global mean methane levels as high as 1836 parts per billion were recorded at several altitudes on August 24, 2014. Meanwhile, the Arctic Ocean continues to warm up. As the image below shows, the ocean heat is felt strongly on the Northern Hemisphere.
Very warm waters from the North Pacific and the North Atlantic Oceans are now invading the Arctic Ocean. Never before in human history have these waters been this warm. In the Arctic Ocean, this is causing very high sea surface temperatures, as shown on the image below.

[ click on image to enlarge ]
The very high temperatures threaten to trigger all kinds of feedbacks, as described in the image below.

Feedbacks in the Arctic
The big danger is that, as the seabed warms up, methane will erupt from hydrates in sediments under the Arctic Ocean. The situation is dire and calls for comprehensiev and effective action, as discussed at the Climate Plan blog.


Tuesday, April 8, 2014

March 2014 Arctic Sea Ice Volume 2nd lowest on Record

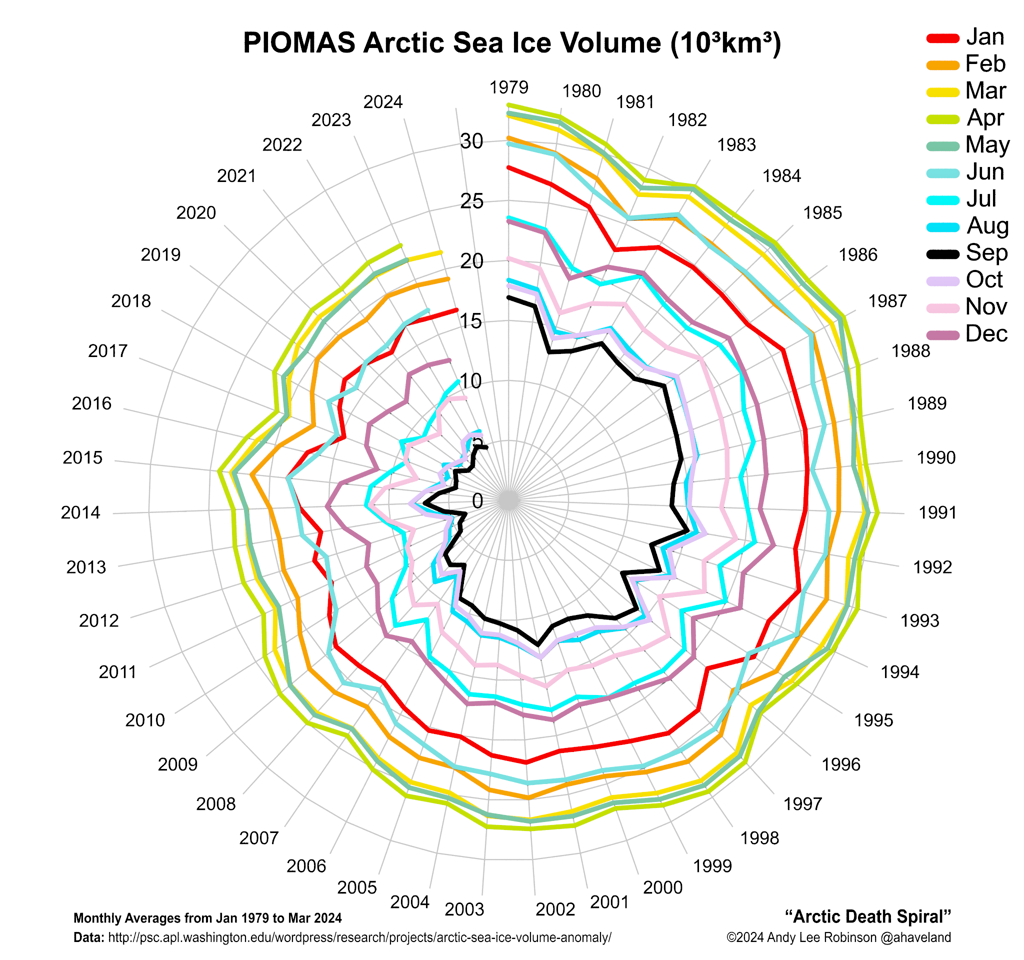
The March 2014 Arctic sea ice volume, as calculated by the Pan-Arctic Ice Ocean Modeling and Assimilation System (PIOMAS) at the Polar Science Center, was the 2nd lowest on record at 21.818 km³. Only March 2011 had a lower volume, at 21.421 km³, as illustrated by the graph below, by Wipneus.
Another way of depicting the continued fall of the sea ice volume is the Arctic Death Spiral below, by Andy Lee Robinson.

This puts the sea ice in a very weak position. This month, the sea ice will reach its highest volume, which may well be the lowest volume on record for April. The Naval Reserach Laboratory 30-day animation below shows recent sea ice thickness.


The lowest sea ice volume for 2014 is expected to be reached in September, and - given the shape the ice is in now - will likely be one of the lowest minima on record. In fact, there is a chance that there will be no ice left whatsoever later this year. As illustrated by the image below, again by Wipneus, an exponential curve based on annual minima from 1979 points at zero ice volume end 2016, with the lower limit of the 95% confidence interval pointing at zero ice end of 2014.
Absence of sea ice will mean that a lot of more heat will be absorbed by the Arctic Ocean.

As NSIDC.org describes, sea ice reflects 50% to 70% of the incoming energy, but thick sea ice covered with snow reflects as much as 90% of the incoming solar radiation. After the snow begins to melt, and because shallow melt ponds have an albedo of approximately 0.2 to 0.4, the surface albedo drops to about 0.75. As melt ponds grow and deepen, the surface albedo can drop to 0.15. The ocean reflects only 6% of the incoming solar radiation and absorbs the rest. Furthermore, all the heat that during the melt went into transforming ice into water will - in the absence of ice - be absorbed by the ocean as well.


Such feedbacks are causing warming to accelerate in the Arctic Ocean, much of which is very shallow and thus vulnerable to warming. The Gulf Stream can be expected to keep carrying warmer water into the Arctic Ocean. Extreme weather events such as heatwaves and cyclones could make the situation a lot worse.

Warming of the Arctic Ocean threatens to destabilize huge amounts of methane held in sediments at the seafloor, in the form of free gas and hydrates. The danger is that release of methane from the seafloor of the Arctic Ocean will warm up the Arctic even further, triggering even more methane releases, as well as heatwaves, wildfires and further feedbacks, in a spiral of runaway warming that will lead to starvation, destruction and extintion at massive scale across the globe.

In conclusion, the situation is dire and calls for comprehensive and effective action, as discussed at the climate plan blog.


Tuesday, April 1, 2014

Earthquakes in the Arctic Ocean

Earthquakes in the Arctic Ocean
indications of immiment catastrophic methane eruptions?

1. Methane over Greenland

The image below shows high methane concentrations over Greenland and over the Arctic Ocean.

[ Yellow areas indicate methane readings of 1950 ppb and higher - click on image to enlarge ]
The large yellow areas on this image indicate that the methane entered the atmosphere there. This is especially likely when such large yellow areas keep appearing in the same area over a few days. In the case of the large yellow areas around Novaya Zemlya, the methane is likely to have travelled there underneath the sea ice, from the Gakkel Ridge, to enter the atmosphere where the sea ice was thin or fractured enough for the methane to pass through, as discussed in earlier posts.

As described in the post High methane readings over Greenland, huge temperature swings can hit areas over Greenland over the course of a few days. Temperature anomalies may go down as low as as -20°C one day, then climb as high as 20°C a few days laters, to hit temperature anomalies as low as -20°C again some days later.

This could explain the methane over Greenland. Methane is present in the Greenland ice sheet in the form of hydrates and free gas. These huge temperature swings are causing the ice to expand and contract, thus causing difference in pressure as well as temperature. The combined shock of wild pressure and temperature swings is causing movement and fractures in the ice, and this enables methane to rise to the surface and enter the atmosphere.

To further illustrate this, the image below shows recent temperature anomaly forecasts over Greenland.

[ click on image to enlarge ]
2. What is causing these extreme weather events?

Frigid cold weather in the U.S., torrential rain and flooding in the U.K., and wild temperature swings over Greenland. What is causing these extreme weather events? 

As discussed in many previous posts, the Arctic has become warmer than it used to be and temperatures in the Arctic are rising several times faster than global temperatures. This decreases the temperature difference between the areas to the north and to the south of the Jet Stream, which in turn decreases the speed at which the Jet Stream circumnavigates the globe, making the Jet Stream more wavier and increasing opportunities for cold air to descend from the Arctic and for warm air to enter the Arctic.

3. Did temperature swings also trigger earthquakes?

[ click on image to enlarge ]
These wild temperature swings may be causing even further damage, on top of the methane eruptions from the heights of Greenland. Look at the above map, showing earthquakes that hit the Arctic in March 2014.
Topographic map of Greenland
without the Greenland Ice Sheet.

BTW, above map doesn't show all earthquakes that occured in the Arctic Ocean in March 2014. An earthquake with a magnitude of 4.5 on the Richter scale hit the Gakkel Ridge on March 6, 2014.

Importantly, above map shows a number of earthquakes that occurred far away from faultlines, including a M4.6 earthquake that hit Baffin Bay and a M4.5 earthquake that hit the Labrador Sea. These earthquakes are unlikely to have resulted from movement in tectonic plates. Instead, temperature swings over Greenland may have triggered these events, by causing a succession of compression and expansion swings of the Greenland ice mass, which in turn caused pressure changes that were felt in the crust surrounding the Greenland Ice Sheet.

Glaciers could be the key to make this happen. Glaciers typically move smoothly and gradually. It could be, however, that such wide temperature swings are causing glaciers to come to a halt, temporarily, causing pressure to build up over a day or so, to then suddenly start moving again with a shock. Intense cold can literally freeze a glacier in its track, to be shocked into moving again as temperatures rise abruptly by 40°C or so. This can send shockwaves through the ice sheet into the crust and trigger earthquakes in areas prone to destabilization. The same mechanism could explain the high methane concentrations over the heights of Greenland and Antarctica.

Ominously, patterns of earthquakes can be indicators of bigger earthquakes yet to come.

4. Situation looks set to get a lot worse

This situation looks set to get a lot worse. Extreme weather events and wild temperature swings look set to become more likely to occur and hit Greenland with ever greater ferocity. Earthquakes could reveberate around the Arctic Ocean and destabilize methane held in the form of free gas and hydrates in sediments underneath the Arctic Ocean.

Meanwhile, as pollution clouds from North America move (due to the Coriolis Effect) over the Atlantic Ocean, the Gulf Stream continues to warm up and carry warmer water into the Arctic Ocean, further increasing the likelihood of methane eruptions from the Arctic seafloor.


The above image shows the Gulf Stream off the coast of North America, while the image below shows how the Gulf Stream continues, carrying warmer water through the Atlantic Ocean into the Arctic Ocean.


Feedbacks, such as the demise of the Arctic's snow and ice cover, further contribute to speed up the unfolding catastrophe. Methane eruptions from the seafloor of the Arctic Ocean have become especially noticable over the past half year. The big danger is that this will develop into runaway global warming, as discussed in the recent post Feedbacks in the Arctic.

Furthermore, as-yet-unknown feedbacks may start to kick in. As an example, submarine earthquakes and volcanos could add nutrients into the water that feed methane-producing (methanogenic) microbes. A recent study found that expansion of such microbes could have played a large role in the end-Permian extinction, and that it was catalyzed by increased availability of nickel associated with volcanism. Authors support their hypothesis with an analysis of carbon isotopic changes leading up to the extinction, phylogenetic analysis of methanogenic archaea, and measurements of nickel concentrations in South China sediments.

5. Need for comprehensive and effective action

The situation calls for comprehensive and effective action as discussed at the Climate Plan blog.


Related

- Methane Release caused by Earthquakes
http://arctic-news.blogspot.com/2013/09/methane-release-caused-by-earthquakes.html

- Seismic activity
http://arctic-news.blogspot.com/p/seismic-activity.html

- Climate Plan
http://climateplan.blogspot.com


Thursday, March 20, 2014

Feedbacks in the Arctic

This is more a climate report than a weather report; yet, the extreme weather that did hit the U.K. recently and that is forecast to hit large parts of North America next week may make more people realize that action is needed now. So, please share!

At the moment, a large part of Russia is experiencing temperature anomalies at the highest end of the scale, i.e. more than 36°F (20°C) warmer than average past records.


Above image shows the situation as at March 20, 2014. The image below is a forecast for March 22, 2014.


Over the past year, average temperatures over the Arctic Ocean have been much higher than they used to be, as illustrated by the NOAA image below.

Warming in the Arctic is accelerating, in part due to a number of feedbacks such as extreme weather. Temperatures over the Arctic Ocean are expected to rise even further next week. The Arctic as a whole is expected to reach average anomalies as high as 5.3°C next week, while many areas over the Arctic Ocean are expected to be hit by even higher anomalies, as the image below shows.

 [ click on image to enlarge ]
Above image also shows that, at the same time, very low temperatures - with anomalies at the low end of the scale - are expected to hit a large part of North America. The image below shows what temperatures can be expected on March 26, 2014, 12:00 UTC.


As above image illustrates, temperatures over a large part of North America can be expected to be hardly higher than temperatures over the Arctic Ocean mid next week. It is this very difference between high altitude temperatures and lower altitude temperatures that drives the Jet Stream. In the absence of much difference, changes to the Jet Stream are making it easier for cold air to move out of the Arctic and for warm air from lower latitudes to move in. The Polar Vortex is similarly affected, as illustrated by the image below.


At lower altitude, the highest wind speed detected on the image below was 94 km/h (green marker). Strong winds brought a lot of rain from the Atlantic Ocean to the U.K., as has been the case for some time.

[ click on image to enlarge ]
The result is more extreme weather, which can translate into more intense storms, heatwaves, droughts, wildfires and further havoc. Importantly, storms across the Arctic Ocean and higher wind speeds along the edges of Greenland can break up the ice and speed up its exit from the Arctic Ocean. The Naval Research Laboratory animation below shows strong winds pushing the sea ice around and speeding up its exit along the edges of Greenland. 


Despite the cold weather that has hit large parts of North America over the past few months, the water off the coast of North America has not cooled, as illustrated by the image below. The blue and lilac colored areas are in part the result of exit currents carrying cold water out of the Arctic Ocean more rapidly, while the Gulf Stream continues to carry warmer water (brown and red colored areas) into the Arctic Ocean. 

[ Sea Surface Temperatures (SST) - click on image to enlarge ]
The Arctic is especially vulnerable to warming, due to a number of circumstances, including:
- Gulf Stream carrying warmer water into the Arctic Ocean;
- Arctic snow and ice cover is at the verge of collapse;
- Methane is present in large quantities under the seafloor of the Arctic Ocean.
These circumstances and the combined impact of feedbacks such as extreme weather make that, on top of global warming, the Arctic is hit by a second, addtional kind of warming, i.e. accelerating warming in the Arctic.

The joint impact of feedbacks is becoming stronger, as temperatures keep rising in the Arctic and with continued demise of the snow and ice cover. So, let's start with feedback #1, i.e. that, as snow and ice cover decline further, an ever larger part of the sunlight will be absorbed by the Arctic Ocean, rather than to (a) be reflected back into space or (b) be consumed in the process of transforming ice into water. This first feedback will then be amplified by further feedbacks such as storms that can more easily develop in open water. And, as the weather becomes more extreme, stronger storms and heatwaves can be expected to hit the Arctic Ocean, causing further demise of the sea ice, resulting in more heat being absorbed by the Arctic Ocean. Thus, feedbacks can amplify each other, causing warming in the Arctic to accelerate even further. 

One of the most dangerous feedbacks is that, as the Arctic Ocean warms up further and as the Gulf Stream carries ever warmer water into the Arctic Ocean, methane can erupt from the seafloor of the Arctic Ocean in large quantities. Methane eruptions from the seafloor of the Arctic Ocean have become especially noticable over the past half year. The big danger is that this will develop into a third kind of warming, runaway global warming. 

Large amounts of methane are still entering the atmosphere over the Arctic Ocean, which contains very little hydroxyl to start with, so large abrupt releases will deplete the little hydroxyl that is there much faster than elsewhere. Furthermore, the methane will initially be highly concentrated in the atmosphere over the Arctic Ocean, and where the methane does move out of the Arctic, it could warm up the water along the track of the Gulf Stream, causing even warmer water to enter the Arctic Ocean. For years after its release, the methane will act as a powerful greenhouse gas. Unlike the albedo changes, which have the highest impact at the June Solstice when the amount of solar radiation received by the Arctic is higher than anywhere else on Earth, methane prevents heat from radiating out into space throughout the year. 

The interactive diagram below gives an overview of these three kinds of warming and the numerous feedbacks that are accelerating warming in the Arctic, from the earlier post The Biggest Story of 2013.

Hover over each kind of warming and feedback to view more details, click to go to page with further background 
Image Mapemissions cause global warmingArctic warming accelerated by soot, etc.additional warming of Gulf Stream by emissions methane releases escalatePolar vortex and jet stream weaken as Arctic warmssnow and ice decline causing less sunlight to be reflected back into spacemethane releases warm Arctic airas sea ice decline weakens vertical currents, seabed warmsStorms cause vertical mixing of wateraccelerated Arctic warming causes storms that push cold air of the Arcticextreme weather causing storms that push away sea iceextreme weather causing storms that create higher waves, breaking up the sea icestorms creating more wavy waters that absorb more sunlightextreme weather causing fires, etc.weaker polar vortex and jet stream let cold air move out of Arcticextreme weather causing warmer waterssnow and ice decline cause seismic activity that destabilizes hydratesmethane releases prevent sea ice from forming

In conclusion, the situation is dire and calls for comprehensive and effective action, as described at the Climate Plan blog.


Related

- The Biggest Story of 2013
http://arctic-news.blogspot.com/2013/12/the-biggest-story-of-2013.html

- Climate Plan
http://climateplan.blogspot.com

- Changes to Polar Vortex affect mile-deep ocean circulation patterns
http://arctic-news.blogspot.com/2012/09/changes-to-polar-vortex-affect-mile-deep-ocean-circulation-patterns.html

- Diagram of Doom
http://arctic-news.blogspot.com/2012/08/diagram-of-doom.html

- Polar Jet Stream appears hugely deformed
http://arctic-news.blogspot.com/2012/12/polar-jet-stream-appears-hugely-deformed.html

- Methane Levels going through the Roof
http://arctic-news.blogspot.com/2013/11/methane-levels-going-through-the-roof.html

- Ocean heat: Four Hiroshima bombs a second: how we imagine climate change
http://arctic-news.blogspot.com/2013/08/four-hiroshima-bombs-second-how-we-imagine-climate-change.html

- (Three kinds of) Warming in the Arctic
http://arctic-news.blogspot.com/p/warming-in-arctic.html


Feedbacks
  1. Snow and ice decline causing more sunlight to be absorbed by the Arctic Ocean
    http://arctic-news.blogspot.com/2012/07/albedo-change-in-arctic.html
  2. Methane releases warming up Arctic air
    http://arctic-news.blogspot.com/2013/11/methane-levels-going-through-the-roof.html
  3. As sea ice decline weakens vertical currents, seabed warms
    http://arctic-news.blogspot.com/2012/09/arctic-sea-ice-loss-is-effectively-doubling-mankinds-contribution-to-global-warming.html
  4. Storms cause vertical mixing of water
    http://arctic-news.blogspot.com/2012/07/arctic-waters-are-heating-up.html
  5. Accelerated Arctic warming causes storms that push cold air of the Arctic
    http://arctic-news.blogspot.com/2012/08/diagram-of-doom.html
  6. Extreme weather causing storms that push away sea ice
    http://arctic-news.blogspot.com/2012/04/supplementary-evidence-by-prof-peter.html
  7. Extreme weather causing storms that create higher waves, breaking up the sea ice
    http://arctic-news.blogspot.com/2012/08/huge-cyclone-batters-arctic-sea-ice.html
  8. Storms creating more wavy waters that absorb more sunlight
    http://arctic-news.blogspot.com/2012/08/diagram-of-doom.html
  9. Extreme weather causing fires, etc.
    http://arctic-news.blogspot.com/2012/07/how-extreme-will-it-get.html
  10. Weaker polar vortex and jet stream let cold air move out of Arctic
    http://arctic-news.blogspot.com/2012/08/opening-further-doorways-to-doom.html
  11. Extreme weather causing warmer waters
    http://arctic-news.blogspot.com/2013/12/the-biggest-story-of-2013.html
  12. Snow and ice decline cause seismic activity that destabilizes hydrates
    http://arctic-news.blogspot.com/2013/09/methane-release-caused-by-earthquakes.html
  13. Methane releases prevent sea ice from forming
    http://arctic-news.blogspot.com/2013/12/methane-emerges-from-warmer-areas.html