Thursday, October 10, 2013

On the need for responsible reporting of research to the media

This was one of the first tweets I saw when I woke up this morning :


In response, a parent of two girls with autism tweeted "gutted to read this. B's statement has been final for 1 yr but no therapy has been done. we're still waiting."


I was really angry. A parent who is waiting for therapy for a child has many reasons to be upset. But the study described on the BBC Website did NOT identify a 'critical window'. It was not about autism and not about intervention.


I was aware of the study because I'd been asked by the Science Media Centre to comment on an embargoed version a couple of days ago.


These requests for commentary on embargoed papers always occur very late in the day, which makes it difficult to give a thorough appraisal. But I felt I'd got the gist: the researchers had recruited 108 children aged between 1 and 6 years and done scans to look at the development of white matter in the brain. They also gave children a well-known test of cognitive development, the Mullen scales, which assesses language, visual and fine motor skills.
It's not clear where the children came from, but their scores on the Mullen scales were pretty average, and as far as I can tell, none of them had any developmental disorders.


The researchers were particularly interested in lateralisation: the tendency to have more white matter on one side of the brain than the other. Left-sided lateralisation of white matter in some brain regions is well-established in adults but there's been debate as to whether this is something that develops early in life, or whether it is present from birth. In the introduction, the authors state that this lateralisation is strongly heritable, but although that's often claimed, the evidence doesn't support it (Bishop, 2013). A preponderance of white matter in the left hemisphere is of interest because in most people, the left side of the brain is strongly involved in language processing.


The authors estimated lateralisation in numerous regions of the left and right brain using a measure termed the myelin water fraction. Myelin is a fatty sheath that develops around the axons of cells in the brain, leading to improved efficiency of neural transmission. Myelination is a well-established phenomenon in brain development.


The main findings I took away from the paper were (a) myelin is asymmetrically distributed in the brains of young children, with many regions showing greater myelin density in the left than the right; (b) although the amount of myelin increases with age, the extent of lateralisation is stable from 1 to 6 years. This is an important finding.


The authors, however, put most focus on another aspect of the study: the relationship between myelin lateralisation and language level. Overall, there was no relationship with asymmetry of a temporal-occipital region that overlapped with the arcuate fasciculus, a fibre tract important for language that previously had given rather inconsistent results (see Bishop, 2013). However, looking at a total of eight brain regions and four cognitive measures, they found two regions where leftward asymmetry was related to language or visual measures, and one where rightward asymmetry was related to expressive and receptive language.


Their primary emphasis, however, was on another finding, that there were interactions between age and lateralisation, so that, for instance, left-sided lateralisation of myelin in a region encompassing caudate/thalamus and frontal cortex only became correlated with language level in older children. I found it hard to know how much confidence to place in this result: the authors stated that they corrected for multiple comparisons using false discovery rate, but if, as seems the case, they looked at both main effects and interaction terms in 32 statistical analyses, then some of these findings could be chance.


Be that as it may, it is an odd result. Remember that this was a cross-sectional study and that on no index was there an age effect on lateralisation. So it does not show that changes in language ability - which are substantial over this age range - are driven by changes in lateralisation of myelin. So what do the authors say? Well, in the paper, they conclude "The data presented here are cross sectional, longitudinal analysis will allow us to confirm these findings; however, the changing interaction between ability and myelin may be mediated by progressive functional specialization in these connected cortical regions, which itself is partly mediated by environmental influences" (p. 16175). But this is pure speculation: they have not measured functional specialisation, and, as they appear to recognise, without longitudinal data, it is premature to interpret their results as indicating change with age.


If you've followed me so far, you may be wondering when I'm going to get on to the bit about intervention for autism and critical periods. Well, there's no data in this paper on that topic. So why did the BBC publish an account of the paper likely to cause dismay and alarm in parents of children with language and communication problems? The answer is because King's College London put out a press release about this study that contained at least as much speculation as fact. We are told that the study "reveals a particular window, from 2 years to the age of 4, during which environmental influence on language development may be greatest." It doesn't do anything of the kind. They say: "the findings help explain why, in a bilingual environment, very young typically developing children are better capable of becoming fluent in both languages; and why interventions for neurodevelopmental disorders where language is impaired, such as autism, may be much more successful if implemented at a very young age. " Poppycock.


A few months ago the same press office put out a similarly misleading press release about another study, quoting the principal researcher as stating: “Now we understand that this is how we learn new words, our concern is that children will have less vocabulary as much of their interaction is via screen, text and email rather than using their external prosthetic memory. This research reinforces the need for us to maintain the oral tradition of talking to our children.” As I noted elsewhere, the study was not about children, computers or word learning.


I can see that there is a problem for researchers doing studies of structural brain development. It can be hard to excite the general public about the results unless you talk about potential implications. It is frankly irresponsible, though, to go so far beyond your data that the headline is based on the speculation rather than the findings.


I am tired of researchers trying to make their studies relevant by dragging in potential applications to autism, schizophrenia, or dyslexia, when they haven't done any research on clinical groups. They need to remember that there are real people out there whose everyday life is affected by these conditions, and that neither they nor the media can easily discriminate what a study actually found from speculations about its implications. It is the duty of researchers and press officers to be crystal clear about that distinction to avoid causing confusion and distress.


POSTSCRIPT

11/10/13: Dr O'Muircheartaigh has commented below to absolve the KCL Press Office of any responsibility for the content of their press release. I apologise for assuming that they were involved in decisions about how to publicise this research and have reworded parts of this blogpost to remove that implication.


References 


Bishop, D. V. M. (2013). Cerebral asymmetry and language development: Cause, correlate, or consequence? Science, 340 (6138) DOI: 10.1126/science.1230531


O'Muircheartaigh, J., Dean, D. C., Dirks, H., Waskiewicz, N., Lehman, K., Jerskey, B. A., & Deoni, S. C. L. (2013). Interactions between white matter asymmetry and language during neurodevelopment. Journal of Neuroscience, 33(41), 16170-16177. doi: 10.1523/jneurosci.1463-13.2013


Wednesday, October 9, 2013

High time to revise the PhD thesis format


Before the electronic age: Henry Wellcome's dissertation from 1874

I don't know how it works in other countries, but in the UK, if you agree to examine a PhD thesis, odds are you will receive a bound document of some 250-400 pages to evaluate. You are not supposed to write on it. You may be explicitly forbidden to obtain an electronic version of the document.


There are ways of dealing with this: the most useful one, taught to me by Uta Frith when we co-examined a thesis some years ago, was to make ample use of post-it notes. However, this is still pretty tedious. What I want is a loose-leaf document that I can write on. I want, when travelling on a train to be able to take a chapter or two with me.


Please, can somebody fix this?

Tuesday, October 8, 2013

Abrupt Climate Change

What is Abrupt Climate Change?

Abrupt climate change is defined by the IPCC as a large-scale change in the climate system that takes place over a few decades or less, persists (or is anticipated to persist) for at least a few decades, and causes substantial disruptions in human and natural systems.

Examples of components susceptible to such abrupt change are clathrate methane release, tropical and boreal forest dieback, disappearance of summer sea ice in the Arctic Ocean, long-term drought and monsoonal circulation.

Deposits of methane clathrates below the sea floor are susceptible to destabilization via ocean warming.

Anthropogenic warming will very likely lead to enhanced methane emissions from both terrestrial and oceanic clathrates.

Above extracted from:
- Intergovenmental Panel on Climate Change (IPCC), AR5 Workgroup 1, Technical Summary

New Finding Shows Climate Change Can Happen in a Geological Instant

The Paleocene/Eocene thermal maximum (PETM) is a climate shift that occurred 55 million years ago.

James Wright, Rutgers University Research News -
Morgan Schaller, James Wright, and the core sample
that helped them understand what happened
– and how fast it happened – 55 million years ago.
In a new paper in the Proceedings of the National Academy of Sciences, Morgan Schaller and James Wright present their finding that climate change can and did happen abruptly, or in geological terms, instantaneously.

Following a doubling in carbon dioxide levels, the surface of the ocean turned acidic over a period of weeks or months and global temperatures rose by 5 degrees centigrade – all in the space of about 13 years.

“We’ve shown unequivocally what happens when CO2 increases dramatically – as it is now, and as it did 55 million years ago,” James Wright said.

The film below goes into more detail regarding the current situation.

New Film: Last Hours

The film “Last Hours” describes a science-based climate scenario where a tipping point to runaway climate change is triggered by massive releases of frozen methane. Methane, a powerful greenhouse gas, has already started to percolate into the open seas and atmosphere from methane hydrate deposits beneath melting arctic ice, from the warming northern-hemisphere tundra, and from worldwide continental-shelf undersea methane pools.

“Last Hours” is narrated by Thom Hartmann and directed by Leila Conners. Executive Producers are George DiCaprio and Earl Katz.


For more, also watch some of Thom Hartmann’s interviews.

High Methane Levels persist over Arctic Ocean

High methane levels are prominent over the Arctic Ocean, as illustrated by the image below, covering a period from October 3, 2013, 10:54 am to October 7, 2013, 11:53 pm. The fact that methane has not been present elsewhere in such high concentrations over this period indicates that the methane wasn't carried there by the wind from elsewhere. Also, methane typically appears to move along the same latitude, due to the Coriolis effect.


The image indicates a link between seismic activity and destabilization of methane that is held in sediments under the Arctic Ocean. Methane does show up prominently along the fault line that crosses the Arctic Ocean and extends into Siberia over the Laptev Sea.

The Diagram that IPCC failed to include in AR5

The diagram below shows global warming evolving into accelerated warming in the Arctic. Feedbacks such as albedo changes and methane release speed up this process, triggering abrupt climate change and finally extinction.

The Diagram the IPCC failed to include in AR5

This threatening situation calls for an Effective and Comprehensive Climate Plan, such as depicted by the green lines of action in the image below and as further described at the ClimatePlan blog. For more background, see related posts further below.


Related posts

- Just do NOT tell them the monster exists
http://arctic-news.blogspot.com/2013/10/just-do-not-tell-them-the-monster-exists.html

- Methane Release caused by Earthquakes
http://arctic-news.blogspot.com/2013/09/methane-release-caused-by-earthquakes.html

- Climate Plan
http://climateplan.blogspot.com


Sunday, October 6, 2013

Algae Bloom or Clathrates

There has been some discussion lately as to whether the high levels of methane observed over the Arctic Ocean originated from algae bloom or from clathrates (i.e methane hydrates).

The image below, from Arctic.io, does indeed indicate extensive algae bloom.

[ click on image to enlarge ]
The green color indicates extensive algae bloom, especially in areas where the sea water has been very warm recently, as discussed in earlier posts such as 'Is the North Pole now ice-free?' The image below shows sea surface temperature anomalies as at September 30, 2013.

[ click on image to enlarge ]
Indeed, no surprise to see extensive algae bloom, especially close to Svalbard, where the highest anomalies were recorded. The question is, however, where the methane came from that has showed up so prominently over the Arctic Ocean recently. The animation below shows methane readings over the past week, against a recent sea ice concentration map.


[ click on image to enlarge ]


These high methane levels appear to show up over the sea ice, rather than over open water. This makes it more likely that the methane originates from deep sea clathrates. The color red indicates that the sea ice has maximum concentration, so there will be few holes in the ice where algae can grow. As the top image shows, the green color shows up in areas with open water, rather than over areas covered with ice.

The image below shows sea ice thickness for the same date as the sea ice concentration map.


Even at places where the sea ice has been very thin recently, such as on the North Pole and as discussed in the post North Hole, it is now at least some 30 cm thick, making it unlikely that algae are grow there.

In conclusion, it is likely that the methane originates from deep sea clathrates, and that is a very scary development.


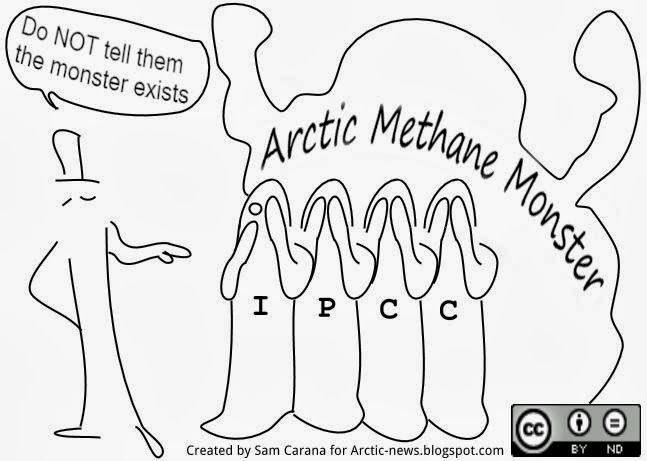
Just do NOT tell them the monster exists

The Arctic Methane Monster

As discussed in a previous post, the IPCC appears to be acting as if there was a carbon budget to divide among countries, whereas in reality there is a huge carbon debt to our children, while the situation could become catastrophic any time soon.

Indeed, carbon dioxide is not the only greenhouse gas and the Arctic methane monster is threatening to disrupt the cosy lifetyle of those who want to keep selling parts of such non-existing carbon budgets.

So, who do you think the IPCC has been listening to, to reach a conclusion after six years of analysis? Experts or snake oil sellers? The cartoon may give you a hint, but why don't you make up your own mind by going over the IPCC statements and comments below.

Abrupt Climate Change

The IPCC recently issued AR5 documents that included a discussion of Abrupt Climate Change.

from: IPCC AR5 Working Group 1 Technical Summary (final draft)
The IPCC gives some examples:


Yes, methane release from clathrates sounds scary.


If there is little consensus on the likelyhood, then surely some experts do believe it is likely. Yet, the IPCC somehow reaches the following conclusion, and does so with high confidence:


Unlikely? What was the basis for this IPCC conclusion? 

This seems like a conclusion that can only have been reached after a robust analysis of all the evidence. So, how did the IPCC reach this conclusion, given that it did so with such high confidence?

Let's have a look. The above conclusion is preceeded by this statement:


OK, that means clathrates will increasingly become destabilized. The IPCC then adds an argument why this would not result in abrupt climate change this century.


Sure, but that's just one rather insignificant negative feedback, compared to the many more significant positive feedbacks, such as melting causing isostatic rebound that can contribute to the occurrence of earthquakes and landslides, in turn triggering methane release. Yet, without even mentioning these positive feedbacks, the paragraph then jumps to the following conclusion:


If these initial estimates are not insignificant and if it's all rather difficult to formally assess, how then is it possible that the IPCC reached its end-conclusion with such high confidence? Moreover, was there any basis for these "initial estimates"? Perhaps there's more elsewhere in the IPCC documents. Here's another paragraph that preceeded the above.


All this expresses is low confidence in existing modeling and lack of understanding of the various processes. Again, how then is it possible that the IPCC reached its conclusion with such high confidence?

How much methane is currently released from hydrates?

On this, the IPCC says:


OK, so things could become scary. And sure, there are no large abrupt releases taking place now, but that doesn't mean there's not going to be any in future. In case of gradual processes, it makes sense to base projections on historic releases. In case of abrupt releases, however, current releases should not be the basis for reaching a conclusion with high confidence.

So, was the work of Dr. Natalia Shakhova perhaps used as the basis for these estimates? Read on!

How much methane is stored under the Arctic Ocean?

How much methane is present in sediments under the seabed of the Arctic Ocean, in the form of free gas and hydrates? On this, the IPCC says in FAQ6:


That doesn't seem to reflect the estimates of Dr. Natalia Shakhova. According to older estimates, the total amount of methane in the atmosphere is about 5 Gt. Saying that more than 50 Gt of methane could be stored in hydrates the Arctic seems deceptive and appears to be seriously downplaying a very dangerous situation.

Natalia Shakhova et al. in 2010 estimated the accumulated potential for the East Siberian Arctic Shelf (ESAS) region alone (image on the right) as follows:
  • organic carbon in permafrost of about 500 Gt
  • about 1000 Gt in hydrate deposits
  • about 700 Gt in free gas beneath the gas hydrate stability zone.
Back in 2008, Natalia Shakhova et al. considered release of up to 50 Gt of predicted amount of hydrate storage as highly possible for abrupt release at any time. Did the IPCC perhaps misread the figures, mistaking the part of the methane that is ready for abrupt release for the total amount of methane in the Arctic?

How long could it take for large amounts of methane to reach the atmosphere?

How long could it take for large amounts to reach the atmosphere? On this, the IPCC says in FAQ6, in the same and the next paragraph:


Events in which most, if not virtually all methane that escaped from the seabed did enter the atmosphere have been studied in 2002 and published in 2006, as reported at:
http://www.ia.ucsb.edu/pa/display.aspx?pkey=1482
and at:
http://onlinelibrary.wiley.com/doi/10.1029/2005GB002668/abstract

Below, a screenshot from an interview of John Mason with Natalia Shakhova, published at:
http://www.skepticalscience.com/arctic-methane-outgassing-e-siberian-shelf-part2.html


In conclusion, Dr Natalia Shakhova also rejects the idea that methane release from hydrates always takes place gradually, over a long time. Especially in the Arctic, there's a huge danger of abrupt release, given the accelerated warming that takes place in the Arctic, given the huge amounts of methane stored in sediments in the form of free gas and methane, given the presence of a tectonic fault line, etc, etc.

Once released, methane won't get broken down easily in the Arctic Ocean, as this requires the presence of bacteria that can oxidize the methane, as well as free oxygen in the water. Once depleted, oxygen isn't quickly replenished in the Arctic Ocean. Lack of bacteria and depletion of oxygen in the waters of the Arctic Ocean could prevent oxidation of methane rising up in the waters, as described at:
http://methane-hydrates.blogspot.com/2012/03/large-areas-of-open-ocean-starved-of.html

In the Arctic, low temperatures mean there are less bacteria that need more time to break down the methane. In other places, currents may bring bacteria back to the location of the methane plume repeatedly. In the Arctic, many currents are long, so once bacteria have flowed away from the location of the plume, they could be driven out of the Arctic Ocean or may return only after a long time, i.e. too long to survive in Arctic waters which are cold and often ice-covered, so a lot of time little or no sunshine penetrates the waters.

In the Arctic, the danger is much larger that methane releases will overwhelm the capacity of bacteria to break it down in the water. In case of large abrupt releases in the Arctic, the danger is that much of the methane will reach the atmosphere unaffected and remain there for a long time, due to the Jet Stream and the low levels of hydroxyl in the Arctic atmosphere, as further described at:
http://methane-hydrates.blogspot.com/2013/04/methane-hydrates.html

BTW, how did all this methane manage to reach the atmosphere over the Arctic Ocean? 

Methane levels over the Arcic Ocean appear to be rising, as illustrated by the combination of images below, showing methane levels over five years (2009 on the left, to 2013 on the right), each time for the same period (January 21-31) - images by Dr. Leonid Yurganov.

[ Click on image to enlarge - from: Dramatic increase in methane in the Arctic in January 2013 ]
If the IPCC was right, how then was it possible methane levels to rise so sharply and abruptly. How was it possible for large amounts of methane to be present over the deep waters of the Arctic Ocean, as discussed at:
http://arctic-news.blogspot.com/2013/10/methane-over-deep-waters-of-arctic-ocean.html

[ How did this methane get there? - click on image to enlarge - see also: Methane over deep waters of Arctic Ocean ]
There is a wealth of evidence from scientists such as Igor Semiletov and Natalia Shakhova who have - year after year - been taking measurements in the East Siberian Arctic Shelf, complete with first-hand reports that methane plumes have been detected.

"We've found continuous, powerful and impressive seeping structures more than 1,000 metres in diameter. In a very small area, less than 10,000 square miles, we have counted more than 100 fountains, or torch-like structures, bubbling through the water column and injected directly into the atmosphere from the seabed," Dr Semiletov said, "We carried out checks at about 115 stationary points and discovered methane fields of a fantastic scale - I think on a scale not seen before. Some of the plumes were a kilometre or more wide and the emissions went directly into the atmosphere - the concentration was a hundred times higher than normal."  -  Vast methane 'plumes' seen in Arctic ocean as sea ice retreats, by Steve Connor in The Independent, December 13, 2011.

The image below shows a cluster of methane plumes, over one km in diameter, that appeared in the Laptev Sea end September 2011. The image is part of a paper on the unfolding "Methane Catastrophe".


Of course, we all wished that we're wrong about this terrifying Arctic methane threat, but the precautionary principle demands a thorough investigation of observations that appear to be at odds with wishful thinking, especially when the stakes are so high. So, IPCC, where's the evidence?


Related

- Arctic Methane Monster
http://arctic-news.blogspot.com/2013/09/arctic-methane-monster.html

- Methane over deep waters of Arctic Ocean
http://arctic-news.blogspot.com/2013/10/methane-over-deep-waters-of-arctic-ocean.html

- Methane hydrate myths
http://methane-hydrates.blogspot.com/p/myths.html

- Methane hydrates
http://methane-hydrates.blogspot.com/2013/04/methane-hydrates.html

- Methane release caused by earthquakes
http://arctic-news.blogspot.com/2013/09/methane-release-caused-by-earthquakes.html

- Earthquake hits Laptev Sea
http://arctic-news.blogspot.com/2013/09/earthquake-hits-laptev-sea.html

- North Hole
http://arctic-news.blogspot.com/2013/09/north-hole.html

- Seismic activity, by Malcolm Light and Sam Carana (2011)
Arctic-news.blogspot.com/p/seismic-activity.html

- Thermal expansion of the Earth's crust necessitates geoengineering (2011)
Arctic-news.blogspot.com/p/thermal-expansion.html


Saturday, October 5, 2013

Good and bad news on the phonics screen


Teaching children to read is a remarkably fraught topic. Last year the UK Government introduced a
screening check to assess children’s ability to use phonics – i.e., to decode
letters into sounds. Judging from the reaction in some quarters they might as well have announced they were going to teach 6-year-olds calculus. The test, we were
told, would confuse and upset children and not tell teachers anything they did
not already know. Some people implied
that there was an agenda to teach children to read solely using meaningless
materials. This, of course, is not the case. Nonwords are used in assessment
precisely because you need to find out if the child has the skills to attack an
unfamiliar word by working out the sounds. Phonics has been ignored or rejected
for many years by those who assumed that if you taught phonics the child would
be doomed to an educational approach that involved boring drills in meaningless
materials. This is not the case: for
instance, Kevin Wheldall argues that children need to combine teaching of phonics with training in vocabulary and comprehension, and storybook reading
with real texts should be a key component of reading instruction.


There is evidence for the effectiveness of phonics training from
controlled trials,  and I therefore regard it as a positive move
that the government has endorsed the  use
of phonics in schools. However, they continue to meet resistance from many
teachers, for a whole range of reasons. Some just don’t like phonics. Some don’t
like testing children, especially when the outcome is a pass/fail
classification. Many fear that the government will use results of a screening
test to create league tables of schools, or to identify bad teachers. Others question the whole point of screening: This recent piece from the BBC website quotes Christine Blower, the head of the National Union of Teachers, as saying: "Children develop at different levels, the slow reader at five can
easily be the good reader by the age of 11.
” To anyone familiar with the
literature on predictors of children’s reading, this shows startling levels of complacency and ignorance. We have known for years that you can predict with
good accuracy which children are likely to be poor readers at 11 years from
their reading ability at 6 (Butler et al, 1985).


When the results from last year's phonics screen came out I blogged about them, because they looked disturbingly dodgy, with a spike in the frequency distribution at the pass mark of 32. On Twitter, @SusanGodsland has pointed me to a report on the 2012 data where
this spike was discussed. This noted that the spike in the distribution was not seen in a pilot study
where the pass mark had not been known in advance. The spike was played down
in this report, and attributed to “teachers accounting for potential
misclassification in the check results, and using their teacher judgment to
determine if children are indeed working at the expected standard
.” It was
further argued that the impact of the spike was small, and would lead to only
around 4% misclassification.


However, a more detailed research report on the results was rather less mealy-mouthed
about the spike and noted “the national distribution of scores suggests that
pupils on the borderline may have been marked up to meet the expected
standard
.” The authors of that report did the best they could with the data and
carried out two analyses to try to correct for the spike. In the first, they
deleted points in the distribution where the linear pattern of increase in
scores was disrupted, and instead interpolated the line. They concluded that
this gave 54% rather than 58% of children passing the screen. The second approach, which they described as
more statistically robust, was to take all the factors that they had measured
that predicted scores on the phonics screen, ignoring cases with scores close to the
spike, and then use these to predict the percentage passing the screen in the
whole population. When this method was
used, only 46% of children were estimated to have passed the screen when the
spike was corrected for.


Well, this year’s results have just been published. The good news is that there is an impressive increase in percentage of children passing
from 2012 to 2013, up from 58% to 69%. This suggests that
the emphasis on phonics is encouraging teachers to teach children about how letters and sounds go together.


But any positive reaction to this news is
tinged with a sense of disappointment that once again
we have a most peculiar distribution with a spike at the
pass
mark. 


Proportions of children with different scores on phonics screen in 2012 and 2013. Dotted lines show interpolated values.


I applied the same correction as had been used for the 2012 data,
i.e.
interpolating the curve over the dodgy area. This suggested that the
proportion of cases passing the screen was overestimated by about 6%
for both 2012 and 2013. (The precise figure will depend on the exact way
the interpolation is done).


Of course I recognise that any pass mark is arbitrary, and
children’s performance may fluctuate and not always represent their true
ability. The children who scored just below the pass mark may indeed not
warrant extra help with reading, and one can see how a teacher may be tempted
to nudge a score upward if that is their judgement. Nevertheless, teachers who
do this are making it difficult to rely on the screen data and to detect
whether there are any improvements year on year. And it undermines their
professional status if they cannot be trusted to administer a simple reading test objectively.


It has been announced that the pass mark for the phonics screen won’t be
disclosed in advance in 2014, which should reduce the tendency to nudge scores
up. However, if the pass mark differs from
previous years, then the tests won’t be comparable, so it seems likely that
teachers will be able to guess it will remain at 32. Perhaps one solution would
be to ask the teacher to make a rating of whether or not the
test result agrees with their judgement of the child’s ability. If they have an
opportunity to give their professional opinion, they may be less tempted to
tweak test results. I await with interest the results from 2014!


Reference

Butler, Susan R., Marsh, Herbert W., Sheppard, Marlene J., & Sheppard, John L (1985). Seven-year longitudinal study of the early prediction of reading achievement Journal of Educational Psychology, 77, 349-361 DOI: 10.1037//0022-0663.77.3.349

Methane over deep waters of Arctic Ocean

The image below shows a lot of methane over deeper parts of oceans, in particular the Arctic Ocean.

[ click on image to enlarge ]
Let's zoom in and take a closer look at what's happening.

[ click on image to enlarge ]
As earlier discussed in the post Methane release caused by earthquakes, there has been a lot of seismic activity in the Aleutian Islands region all the way up into Alaska, including an earthquake with a magnitude of 7 on the Richter scale on August 30, 2013, and several more recent earthquakes with a higher magnitude than 6 on the Richter scale.

An earthquake with a magnitude of 4.6 on the Richter scale hit the Laptev Sea on September 28, 2013. Furthermore, there have been several earthquakes in Siberia, while an earthquake with a magnitude of 6.7 on the Richter scale recently hit the Sea of Okhotsk, which occurred at a depth of 359.3 miles (578.24 km). Earthquakes at such a depth can be felt at great distances from the epicenter and can destabilize methane hydrates.

The presence of methane over the deeper parts of the Arctic Ocean has been discussed in a number of post at this blog recently (see under related, below). It should serve as a warning to those who believed that all methane escaping from deep-sea hydrates would be oxidized in the water by microbes before entering the atmosphere.

The IPCC appears to still close its eyes for such scenarios. Look at this screenshot from IPCC AR5 WGI TS.3.7:

Low release this century? Well, the danger may seem low now in many places, but the situation is already very dangerous in the Arctic, where hydroxyl levels in the atmosphere are very low, where water temperatures can show huge anomalies and where seas can be very shallow and at times become super-saturated with methane, to the extent that oxygen depletion in the water prevents methane oxidation. In the case of large abrupt release, waters will soon become super-saturated with methane locally, especially in the shallow parts of the Arctic Ocean. Furthermore, low sea temperatures and the peculiarities of currents create conditions in the Arctic Ocean that are not beneficial to the kind of growth of microbes that would decompose methane in oceans elsewhere.

How much methane are we talking about? One look at the top image shows that there's a huge amount of methane over the Arctic Ocean. On October 3, 2013, a peak reading was recorded of 2283 ppb and that wasn't even the highest recent reading, as illustrated by the graph below.


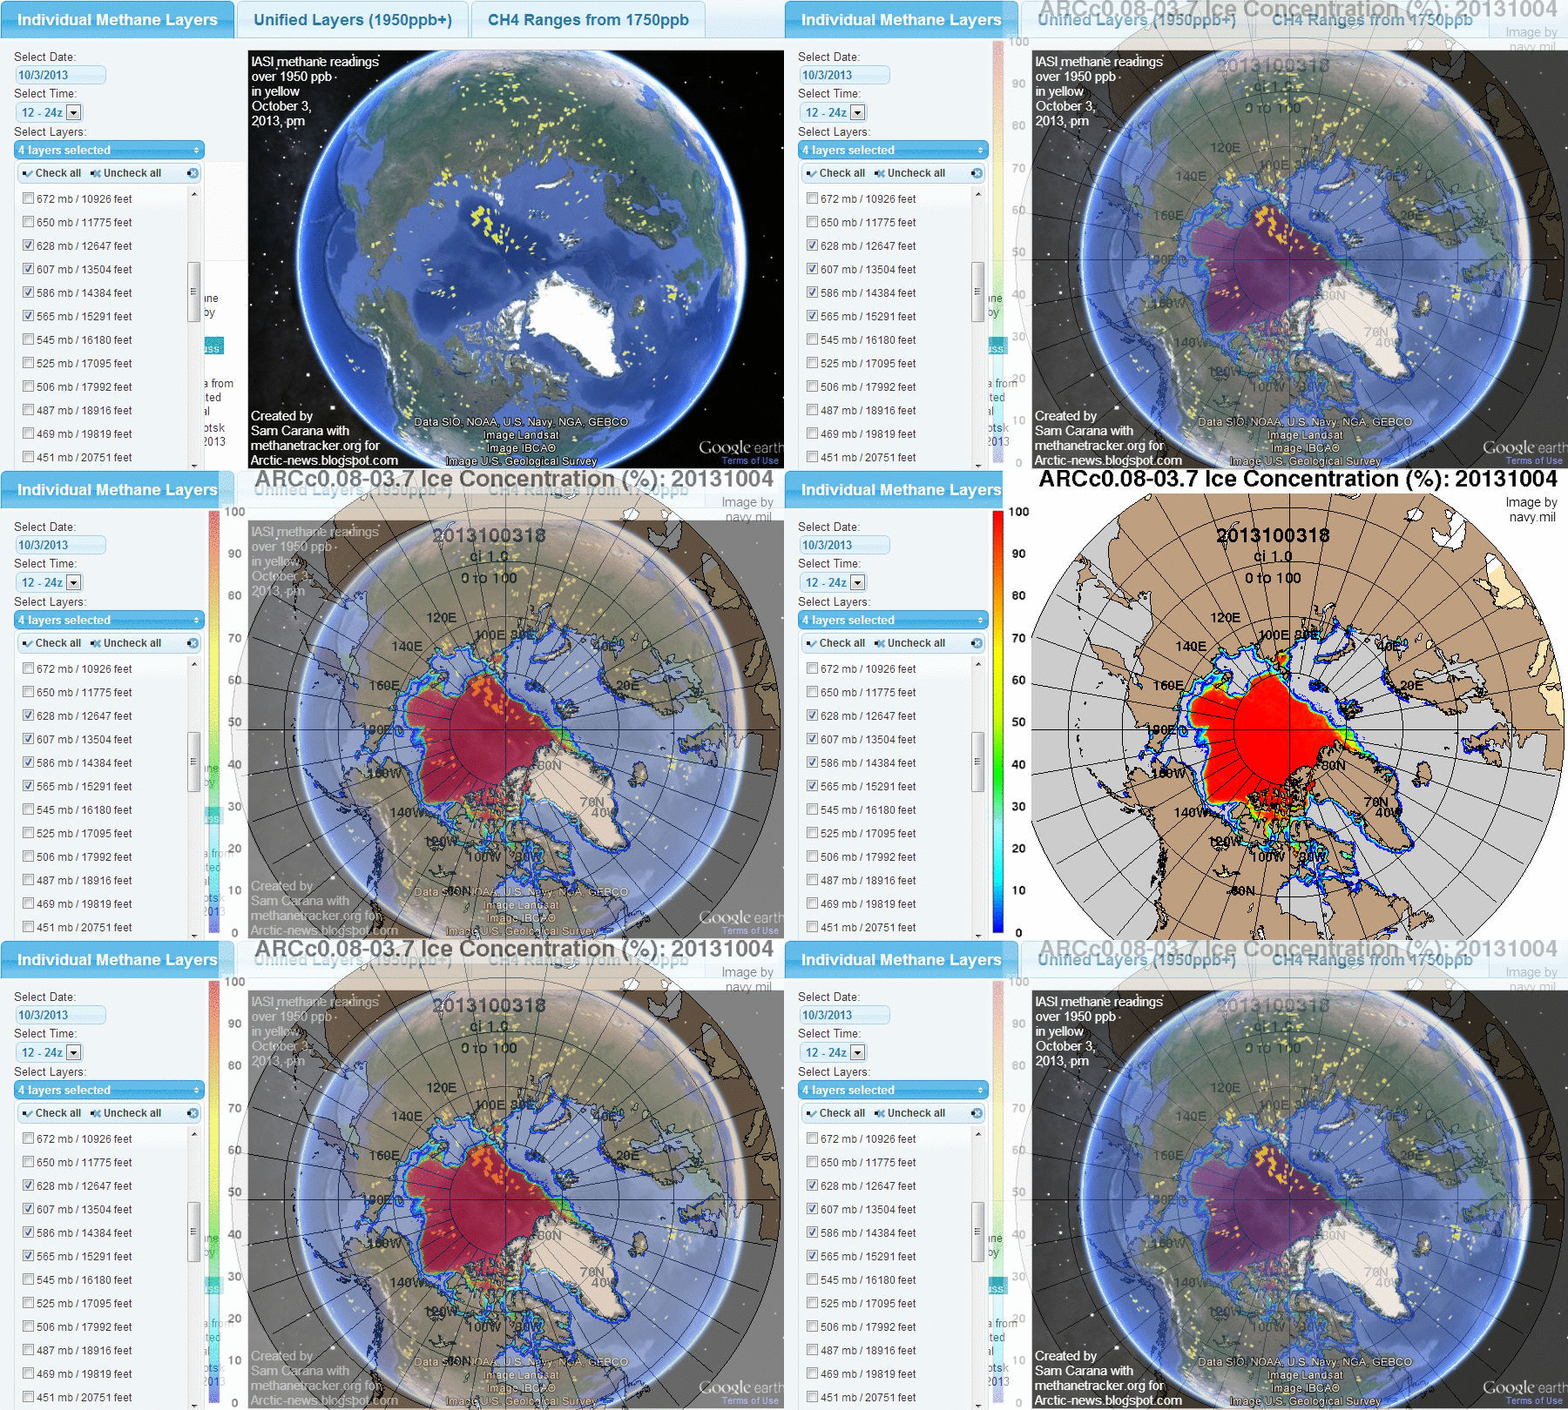
Where were these large amounts of methane released? The animation below shows methane methane readings of over 1950 ppb on October 3, 2013, on the afternoon only and with readings at only four relatively low altitudes, with methane over the Arctic Ocean dominating the picture.


[ click on image to enlarge ]
As the animation further shows, methane seems to perforate ice that currently has the highest concentration levels. Or, the methane could have been bubbling up along the edges of the sea ice. Anyway, methane over deep waters is a worrying development, as it could indicate hydrate destabilization that could become worse.

Does the IPCC point out such dangers? In TS.4.5, the IPCC seems to reach the opposite conclusion, adding that it does so with high confidence:

This is not a trivial matter. A study by Gail Whiteman, Chris Hope and Peter Wadhams, recently published in Nature, concludes that a 50Gt methane release in the Arctic would cause $60 trillion in damages. By comparison, the size of the world economy in 2012 was about $70 trillion. The study adds that such a methane pulse will "bring forward 15–35 years the average date at which the global mean temperature rise exceeds 2°C above pre-industrial levels".

Given that warnings such as addressed by such studies have been sounded for years, one would have expected the IPCC to have taken a very close look at such scenarios. So, what made the IPCC so confident that such catastrophic developments will not eventuate this century? Was there robust evidence behind such a conclusion? Or did the IPCC simply overlook concerns about methane release from the Arctic Ocean seabed? More about that in the next post.

Related

- Methane hydrate myths
http://methane-hydrates.blogspot.com/p/myths.html

- Methane hydrates
http://methane-hydrates.blogspot.com/2013/04/methane-hydrates.html

- Vast costs of Arctic change, in Nature, vol 499, pp 401-403, July 25, 2013
by Gail Whiteman, Chris Hope and Peter Wadhams
http://www.nature.com/nature/journal/v499/n7459/full/499401a.html
http://www.nature.com/nature/journal/v499/n7459/pdf/499401a.pdf

- Methane release caused by earthquakes
http://arctic-news.blogspot.com/2013/09/methane-release-caused-by-earthquakes.html

- Earthquake hits Laptev Sea
http://arctic-news.blogspot.com/2013/09/earthquake-hits-laptev-sea.html

- North Hole
http://arctic-news.blogspot.com/2013/09/north-hole.html

- Sea of Okhotsk
Methane-hydrates.blogspot.com/2013/06/sea-of-okhotsk.html

- Seismic activity, by Malcolm Light and Sam Carana (2011)
Arctic-news.blogspot.com/p/seismic-activity.html

- Thermal expansion of the Earth's crust necessitates geoengineering (2011)
Arctic-news.blogspot.com/p/thermal-expansion.html