Global Warming and the Gulf Stream - Our Atmospheric Pollution Roadway to Subsea Arctic Methane-Induced Climatic Hellby Malcolm P.R. Light, 5th January, 2014
The amount of water presently transported north eastward by the Gulf Stream varies from 30 million cubic metres per second off Florida to a maximum of 150 million cubic metres per second south of Newfoundland at 55
° is transported within this volume of water is approximately equal to the amount carried north east by the atmosphere which gives North Western Europe its milder climate (Wales, 2013).
The surface temperature off the Coast of the United States in the western North Atlantic shows the warm Gulf Stream (in red on Figure 1) while colder oceanic zones are in dark blue (Wales, 2013).
Figure 2 from Csanady (2001) shows the heat gain and loss for the Atlantic Ocean which was posthumously published from Bunker in (1988) In: the North Atlantic from Bunker and Worthington (1976).
Csanady (2001) says that "the contours connect points of equal heat gain in watts per square meter (Wm-2)(negative if heat is lost). The zero-gain contour cuts through this ocean along a diagonal roughly from Spain to the island of Hispaniola in the Caribbean. North of this contour the ocean loses heat, at spectacularly high rates over the warm waters of the Gulf Stream. Here the annual average rate of loss exceeds 200 watts per square meter (exceeds 250 watts per square meter off New England/Canada - my insertion). On the other side of the ocean, off the Norway coast, a northwards tongue of the Warm-Water-Sphere (Gulf Stream - my insertion) is still responsible for heat losses between 50 and 100 watts per square meter, and even higher off Lapland".
When humans get too hot their bodies perspire (sweat) water and this water evaporates at a high rate in windy conditions giving them "wind chill". The excessive heating off the Gulf Stream by pollution clouds pouring off the coast of North America is directly related to excessive heat loss in the same region (Figure 2) because the heat induced extreme atmospheric pressure change generates very strong winds which "wind chill" the overheated ocean there. Gulf Stream water temperatures range up to 13
°C to 26.5
°C (Hurricanes) and water in this temperature range requires about 2440 to 2470 thousand Joules of energy per kilogram for it to change from a liquid into a gaseous state (Latent heat of evaporation; Hyperphysics, 2013; Lide and Fredrickse, 1995). The loss of this latent heat of evaporation is the main reason for the extreme heat loss shown by the hot Gulf Stream waters offshore North America (Figure 2).
Figure 3. shows the yearly human carbon dioxide emissions in tons per person versus inflation adjusted income (Image from gapminder.org, 2013).

The total carbon dioxide emitted by each country is proportional to the size of the circles (Figure 3).
The United Kingdom emitted the most carbon dioxide per person at the start of the industrial revolution but the United States caught up with the U.K. at the start of the 20th century (Figure 3).
From then on the U.S.A. grew to be the largest emitter of carbon dioxide (Figure 3). An average U.S. citizen causes 3 times as much carbon dioxide to be emitted (19 tons of carbon dioxide/person) than a person in China (4.7 tons of carbon dioxide/person)(Figure 3).
China however due to its large population emits a lot of carbon dioxide in total (Figure 3). 5 states, the United Arab Emirates, Saudi Arabia, Australia, U.S.A. and Canada have the most extreme human carbon footprints on Earth (Figure 3) (Light, 2013).
Figures 4a shows the giant equatorial current gyres in the Southern and Northern Hemispheres.
The southern gyre (South Atlantic) is very symetrical, while the northern gyre (North Atlantic) shows extreme asymetry with the elongated core rotational zone lying only a short distance east of the coast of North America and the narrow Gulf Stream current here is elevated and shows the highest volume of transport (150 Sverdrups = 150 million cubic metres per second).
This extreme asymetry is due to global warming from the large volume of pollution clouds pouring off the industrialized zones along the east coast of North America.
This generates a massive atmospheric pressure gradient and accelerates the strong prevailing South Westerly wind flow.
These winds drive the Gulf Stream to high velocities and force surface waters to move offshore from Ekman transport, piling them up (Figure 4b) (Csanady, 2001).
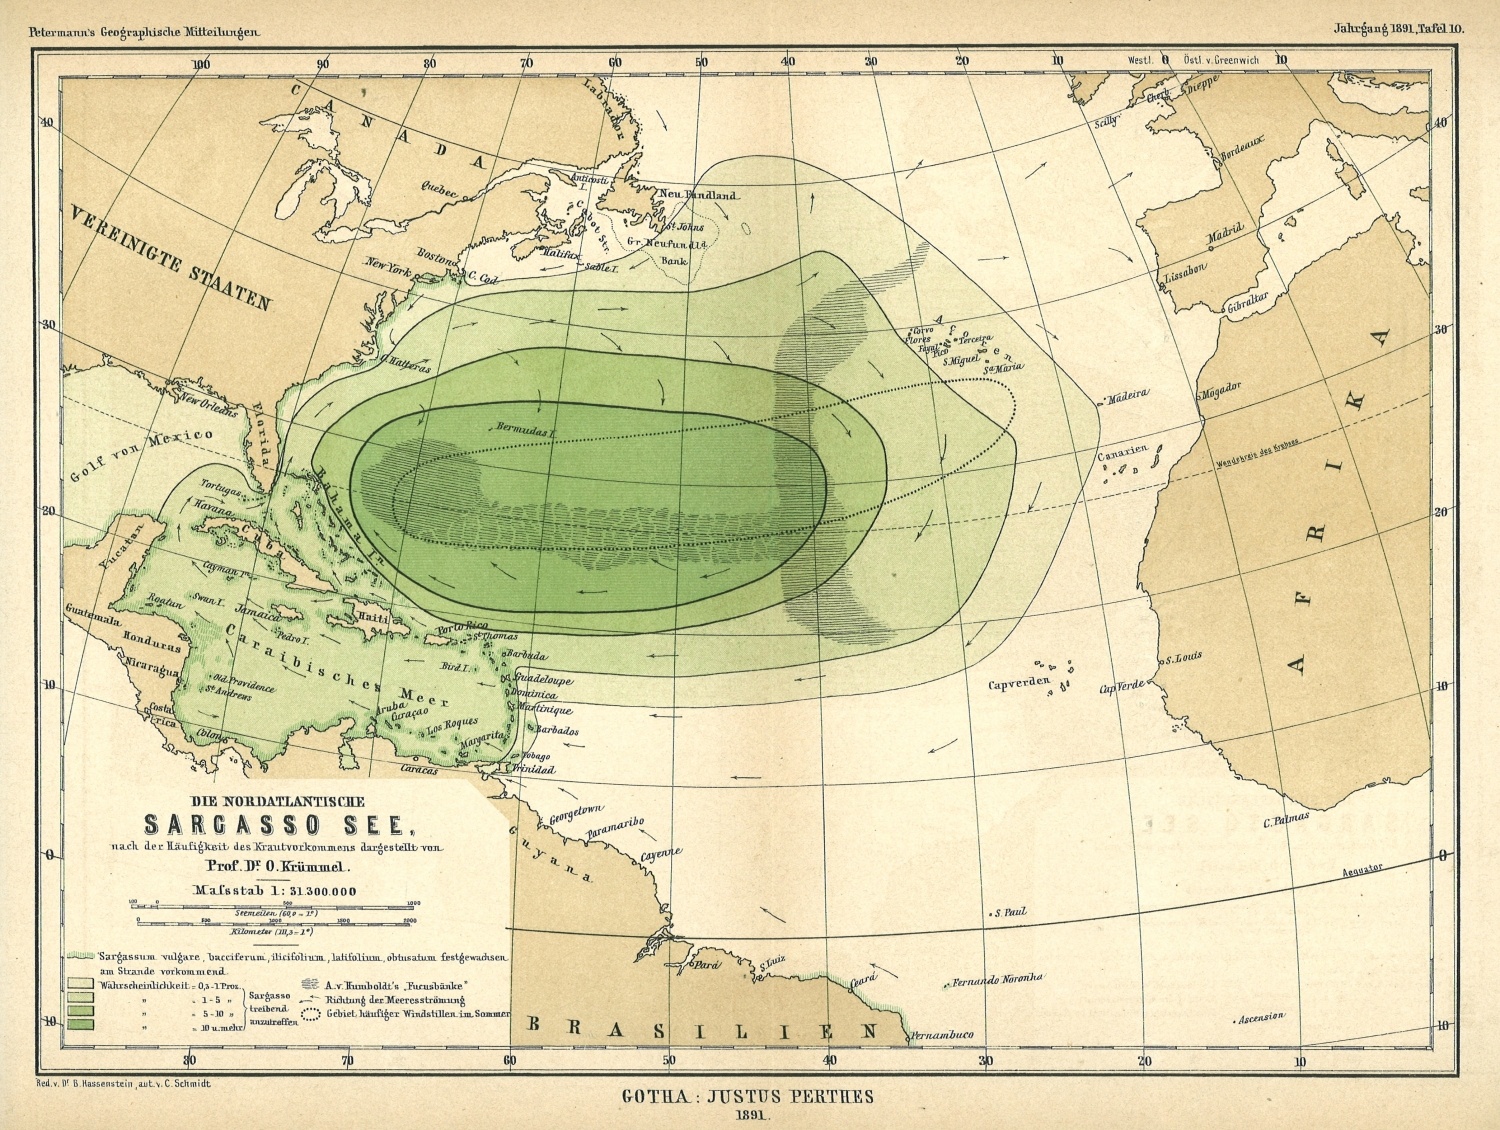
Figure 4b also shows the limited extent of the Sargasso Sea in the late 20th century.
In the late 18th century the Sargasso Sea extended over the entire middle of the North Atlantic (Figure 4c; Krummel 1891).

The extreme asymetry presently The extreme asymetry presently shown by the North Atlantic current gyre (Figure 4d) in the middle of the 20th century was caused by the migration of the rotational core zone more than 1500 km north west as the strength of the prevailing South Westerly winds picked up along the Gulf Stream offshore N. America due to the global warming caused by pollution clouds pouring offshore from the onshore U.S. industries.

The extremely high current transport rates of the Gulf Stream directly offshore the industrialized United States varied from 55 in 1942 to up to 150 Sverdrups (millions of cubic metres/second) at the present day indicating the effects of extreme global warming enhancement here (Figure 4d, Csanady, 2001; Sverdrup, Johnson and Fleming, 1942; Wales, 2013). In addition this map shows the extreme asymmetry of the North Atlantic current gyre, the heated ocean waters in the region of the Gulf Stream (line ornament) and the north east extension of the Gulf Stream via the Hebrides and Norway to the Arctic Ocean (Figure 4d, Sverdrup, Johnson and Fleming, 1942). Csanady (2001) says that:- "
South of the zero-gain contour, over most of the subtropical gyre, the ocean gains heat as colder waters flow southward (Canary Current - my insertion) and absorb solar heat. The energy gain through this "cold water advection" process being, however, moderate, typically 25 watts per square meter. In this region, evaporation is also high, raising the salinity of surface waters". Figure 4d. shows the hot north - east trending Gulf Stream feeding into the North Atlantic Drift and a number of south east trending higher salinity branches which flow clockwise back into the extreme surface salinity zone in the North Atlantic (Weather - online 2012).
The spectacular rates of heat loss from the Gulf Stream waters off the coast of the United States can be clearly followed north east to Norway where they split into the eastern Yermack branch entering the Barents Sea and the West Spitzbergen (Svalbard) Current which dives beneath the floating Arctic Ice Cap (Figure 2). This northward pointing tongue of hot and saline Gulf Stream water is also clearly visible on the salinity map (Figure 5) as strong inflexions in the contours first west of Ireland and then south of Svalbard just before the Gulf Stream dives beneath the floating Arctic Ice cap as the West Spitzbergen Current (Figure 5).

The Gulf Stream (West Spitzbergen Current) follows the southern shelf edge of the Arctic Eurasian Basin to the Laptev Sea destabilizing the subsea Arctic methane hydrates en route and releasing ever increasing amounts of methane into the Arctic atmosphere (Figure 6). The West Spitzbergen Current is still losing some 50 watts per meter by the time it reaches the floating ice cap west of Svalbard but the shallower eastern Yermack Current looses much larger amounts of heat (100 - 600 watts per metre depending on the seasons). Häkkinen and Cavalieri, 1989 indicate that in mid-winter off Lapland, heat losses reach 600 watts per square meter while in August they range from 20 to 40 watts per square meter, where the ice-sheet edge stops any exchange of heat from the sea to the air.

Figures 7, 8 and 9 show the yearly north-eastward Gulf Stream transport of the energy (watts) from the North Atlantic Sub-Tropical Gyre to the Arctic Ocean. The map uses Gulf Stream flow volumes in Sverdrups (= one million cubic metres/second) calibrated to the heat flow trend from eight measured heat flow values along the Gulf Stream (Csanady, 2001). The calibration constant is 3.85 x ten to the power of 7. The heat flow data comes from Csanady, 2001; Gulf Stream flow volumes from Sverdrup, Johnson and Fleming, 1942, Wales J., 2013 and the University of California, (CDL, 2013).
The Gulf Stream shows a zone of anomalously large global warming heating, extremely high rates of South Westerly wind induced ocean current flow, extreme wind chill (caused by evaporation of the sea surface) and elevation of the surface of the Gulf Stream along the coast of the industrialized United States and Canada (Figures 7 to 9 and Figure 4b).
Quite clearly the global warming caused by pollution clouds pouring off the coast of the industialized United States is generating a large air pressure differential, accelerating and heating the prevailing South Westerly Wind flow with its consequent wide ranging effects on the Gulf Stream seen as far north as the central Arctic. As mentioned previously this global warming has increased the rate of water transport from 55 Sverdrups in 1942 to up to 150 Sverdrups at the present (Sverdrup et al. 1942, Wales, 2013).
The heat necessary to liberate methane from the methane hydrates in the Arctic Ocean and cause runaway global warming, total deglaciation and extinction in 2052 represents only one thousandth of the total amount of heat being added to the Arctic ocean by the Gulf Stream (Figure 9). The Yermack Current (E. extension of the Gulf Stream) in the Barents Sea intersects the West Spitzbergen Current (W. extension of the Gulf Stream) at the junction of the Eurasian Basin/Laptev Sea (Figure 7 - 9). This represents an extreme subsea - atmospheric methane emission point above a zone of hydrothermal methane hydrates formed on the Gakkel ridge where it enters the Laptev Sea (Light 2013).
Human-induced global warming caused by the burning of fossil fuels is found to be continuous when the ice, land and atmosphere heating data (Church et al. 2011) is combined with the 5 - year average ocean heat content to a depth of 2000 metres (Levitus et al. 2012)(Figure 10a. Nuccitelli et al. 2012).
The lack of incorporation of this data in the global warming equation by the IPCC, is the reason for the extreme 50 year error found in estimating the floating Arctic ice cap melt time using global atmospheric models as discussed in previous papers (Light 2012, Light 2013). The rate of increase of global warming heat is equivalent to 8 x ten to the power of 21 joules per year (Nuccitelli et al. 2012). The ocean has absorbed 93.4 percent of the heat from global warming (Figure 10b, ACS 2013). The total amount of heat generated by human induced global warming between 1990 and 2010 is some 14 x ten power 22 joules which is equivalent to an absorbed energy flux of 2.2 x ten power 14 watts, i.e about 0.5 watts per square metre of the earth's surface (ACS 2013).

The relative amount of human-induced global warming energy in watts being added every year to the oceans, ice, land and atmosphere and being transferred by the Gulf Stream to the subsea Arctic methane hydrates is shown in Figure 11 (Nuccitelli et al. 2012).
Methane release rates from the East Siberian Arctic Shelf (Shakova et al, 2013) combined with the area of the Arctic Ocean have been used to determine mean methane release rates for the entire Arctic Ocean (Light, 2013). If only a few percent of the subsea methane hydrate reserves in the Arctic Ocean (some 1000 billion tons of Carbon) are dissasociated and the methane released to the atmosphere, it will cause total delaciation and a major extinction event (Light and Solana 2002. The energy necessary to produce these Arctic methane release rates require only about one thousandth of the heat energy input from the Gulf Stream to dissociate the methane hydrates (Figure 11).

Furthermore the energy necessary to produce these Arctic methane release rates represent less than one millionth of the global warming heat energy being added to the oceans, ice, land and atmosphere by human fossil fuel burning (Figure 11). The total human induced global warming is equivalent to 4 Hiroshima atomic bombs detonating every second (Nuccitelli et al. 2012).
Humanity has signed its death warrant and our final extinction will be carried out by Mother Earth within the next 30 to 40 years unless we immediately take extremely drastic action to entirely curb our carbon dioxide pollution, eliminate large quantities of methane from the subsea Arctic Ocean, seawater and atmosphere (down to ca 750 ppm) and revert completely to renewable energy.
The rate of water transport of the Gulf Stream off the industrialized United States, south of New Foundland at 55
° (Sverdrup et al. 1942) to 150 Sverdrups by 2013 (Wales, 2013). This is a 95 Sverdrup increase in transport over 71 years, at a rate of 1.338 Sverdrups/year equivalent to 1.85 x ten to power 14 watts/year using the conservative factor derived in figure 13.85 x ten to power 7 to covert Sverdrups to energy transport in watts/year. Previous analysis of earthquake activity, Arctic ice cap melt back data and the mean atmospheric methane content of the atmosphere indicate that the Arctic methane hydrate (clathrate) gun began to fire continuously in 2007 and the world is now far advanced into runaway global warming which will increase the mean temperature of the atmosphere by 8 degrees C by the mid 21st century (2050 - 2052)(Light 2013). This will lead to total deglaciation and a major extinction event. (Light 2013). The critical transport in 2007 off the Gulf Stream offshore the indutrialized United States, directly south of New Foundland at 55
° west longitude is 42 Sverdrups which precipitated the start of the continuous firing of the methane hydrate (clathrate) gun and runaway global warming.
The Gulf Stream transport rate started the methane hydrate (clathrate) gun firing in the Arctic in 2007 when its energy/year exceeded 10 million times the amount of energy/year necessary to dissociate subsea Arctic methane hydrates. Therefore the United States and Canada must sharply reduce their airborne pollution from fossil fuel extraction and use, to cut back the Gulf Stream transport rate to less than 142 Sverdrups south of New Foundland at 55
° west longitude. Here the Gulf Stream transport rate should be reduced to below 130 Sverdrups or even 100 Sverdrups to make sure that the methane hydrate (clathrate) gun completely terminates firing in the subsea Arctic. Unless this is done immediately humanity will be facing complete extinction in a methane induced firestorm by the middle of this century.
Our Only Hope for SurvivalLight (2013) clearly showed the required massive reduction in global warming fossil fuel burning emissions that the United States and Canada must undertake immediately, if there is any faint hope of stopping the runaway global warming that is now underway (since 2007). The power, prestige and massive economy of the United States has been built on cheap and abundant fossil fuels and Canada is now trying to do the same. The present end of the financial crisis and recovery of the U.S. economy will take us down the same fossil fuel driven road to catastrophe that the U.S. has followed before. Unless the United States, Canada reduce their extreme carbon footprints (per unit population) (Figures 29 and 30), they will end up being found guilty of ecocide and genocide as the number of countries destroyed by the catastrophic weather systems continues to increase.
The United States and Canada with their expanding economies and their growing frenetic extraction of fossil fuels, using the most environmentally destructive methods possible (fracking and shale oil) as well as the population's total addiction to inefficient gas transport is leading our planet into suicide. We are like maniacal lemmings leaping to their deaths over a global warming cliff. What a final and futile legacy it will be for the leader of the free world to be remembered only in the log of some passing alien ship recording the loss of the Earth’s atmosphere and hydrosphere after 2080 due to human greed and absolute energy ineptitude.
The U.S. Government and Canada must ban all environmentally destructive methods of fossil fuel extraction such as fracking, extracting shale oil and coal and widespread construction of the now found to be faulty hydrocarbon pipeline systems. All Federal Government subsidies to fossil fuel corporations, for fossil fuel discovery and extraction must be immediately eliminated and the money spent solely on renewable energy development which will provide many jobs to the unemployed. All long and short range (high consumption) fossil fuel transport must be electrified and where the range is too large, electrical trains must be used instead of trucks for transport. All the major work for this conversion and railway construction can provide a new and growing set of jobs for the unemployed. Nuclear power stations must continue to be used and should be converted to the safe thorium energy system until the transition is complete.
The U.S. has to put itself on a war footing, recall its entire military forces and set them to work on the massive change over to renewable energy that the country needs to undertake, if it wishes to survive the fast approaching catastrophe. The enemy now is Mother Nature who has infinite power at her disposal and intends to take no prisoners in this very short, absolutely brutal, 30 to 40 year war she has begun. I cannot emphasise more, how serious humanity’s predicament is and what we should try to do to prevent our certain final destruction and extinction in the next 30 to 40 years if we continue down the present path we are following .
Monitoring the Effects of a Reduction in Atmospheric Pollution from the United States and CanadaIn conjuction with the massive cut back in pollution emissions by the United States and Canada, the United States must set up a project through the Woods Hole and Rutgers universities to continuously monitor the Gulf Stream flow rate offshore the industrialized United States south of New Foundland at 55
° the critical transport rate of 142 Sverdrups. As already shown, the critical transport in 2007 off the Gulf Stream of 142 Sverdrups precipitated the start of the continuous firing of the methane hydrate (clathrate) gun and runaway global warming. As the United States and Canada sharply reduce their airborne pollution from fossil fuel extraction and use, it will cut back the Gulf Stream transport rate to less than 142 Sverdrups south of New Foundland at 55
° west longitude. Here the Gulf Stream transport rate should be reduced to below 130 Sverdrups or even 100 Sverdrups to make sure that the methane hydrate (clathrate) gun completely terminates firing in the subsea Arctic and humanity has some breathing space to give it time to completely revert to renewable energy. The Gulf Stream transport rate monitoring work of the Woods Hole and Rutgers universities will be of vital significance in humanities last ditch attempt at surviving the fast approaching extinction event.
ReferencesACS 2013. Thermal Energy in the Ocean. ACS Climate Science toolkit/Oceans, Ice and Rocks.
http://www.acs.org/content/acs/en/climatescience/oceanicerocks/thermalenergy.htmlBalmaseda M.A., Trenberth K.E., Källén E., 2013. Distinctive climate signals in reanalysis of global ocean heat content. Geophysical Research Letters, Vol. 40, Issue 9, 1754 - 1759.
Bryden, H.L., 1979. Poleward heat flux and conversion of available potential energy in Drake Passage. J. Marine Res., 37, 1 - 22.
Bunker A.F. 1976. Computations of Surface Energy Flux and Annual Air-Sea Interaction Cycles of the North Atlantic Ocean. Mon. Wea. Rev. 104, 1122 - 1139.
Bunker A.F. 1988. Surface Energy Fluxes in the South Atlantic Ocean. Mon. Wea. Rev. 116, 809 - 829.
Bunker A.F., and Worthington V., 1976. Energy Exchange Charts of the North Atlantic Ocean. Bull. Amer. Meteor. Soc. 57, 670 - 678.
Carana, S. 2011a. Runaway Warming 2011. Geo-engineering blog
http://geo-engineering.blogspot.com/2011/09/runaway-warming.htmlCarana, S. 2011b. Runaway global warming 2011. Knol
http://knol.google.com/k/sam-carana/runaway-global-warming/7y50rvz9924j/64Carana, S. 2011g. Runaway Global Warming. In: Climate Change the Next Generation.
http://climatechangepsychology.blogspot.com/2011/04/sam-carana-runaway-global-warming.htmlCarana, S. 2012. Striking increase of methane in the Arctic. In: Arctic News
http://arctic-news.blogspot.com/2012/05/striking-increase-of-methane-in-arctic.htmlCarana S., 2012. Record levels of greenhouse gases in the Arctic. Arctic News. Wednesday, May 2, 2012.
http://www.3.bp.blogspot.com/hBD8fyXU_A/T6E7CIJEZWI/AAAAAAAACrM/4IU5JVN3rTO/S1600/846537569836.jpgCarana S., 2012. The accumulating impact of methane releases in the Arctic and how much time there is left to act.
http://arctic-news.blogspot.com/p/how-much-time-is-there-left-to-act.htmlCarana S., 2012. How much time is there left to act? Abrupt release of 1 Gt of methane.
http://arctic-news.blogspot.com/p/how-much-time-is-there-left-to-act.htmlCarana S., 2013. Quantifying Arctic Methane.
http://arctic-news.blogspot.com/2013/11/quantifying-arctic-methane.htmlCarana S., 2013. Methane - hydrates.
http://methane-hydrates.blogspot.com/2013/04/methane-hydrates.htmlCarana S., 2013. Methane up to 2241 ppb at 742 mb on January 23, 2013. In: Carana S., 2013, Dramatic increase in methane in the Arctic in January 2013.
http://arctic-news.blogspot.com/2013/02/dramatic-increase-in-methane-in-the-arctic-in-january-2013.htmlCarana S., 2013. Global warming, accelerated warming in the Arctic and runaway global warming. - How much will temperatures rise?.
http://arctic-news.blogspot.com/2013/04/how-much-will-temperatures-rise.htmlCarana S., 2011b. Light, M.P.R. and Carana, S. 2011c. Knol - A unit of Knowledge - Methane linked to seismic activity in the Arctic.
http://knol.google.com/k/sam-carana/methane-linked-to-seismic-activity-in/7y50rvz9924j/85?collectionId=7y50rvz9924j.39#CDL, 2013. The Oceans, their Physics, Chemistry and General Biology. UC Press E-Books Collection, 1982 - 2004. University of California Press. California Digital Library (CDL).
http://publishing.cdlib.org/ucpressebooks/view?docId=kt167nb66r&chunk.id=d3_5_ch15&toc.id=ch15&toc.depth=1&brand=escholChurch J.A., White N.J., Konikow L.F., Domingues C.M., Cogley G., Rignot E., Gregory J.M., van den Broeke M.R., Monagham A.J., Velicogna I., 2011. Revisiting the Earth's sea - level and energy budgets from 1961 to 2008. Geophysical Research Letters. Vol. 40, Issue 15, 4066. Article first published online 8 Aug. 2013.
Cook J. 2013. 4 Hiroshima bombs worth of heat per second. In: Skeptical Science.
http://www.skepticalscience.com/4-Hiroshima-bombs-worth-of-heat-per-second.htmlCsanady G.T., 2001. Air - Sea Interactions. Laws and Mechanisms. Cambridge University Press. 239 pp.
Gapminder, 2012. Yearly Human Carbon Dioxide Emissions
http://www.gapminder.org/worldHäkkinen S., and Cavalieri D.J., 1989. A study of oceanic surface heat fluxes in the Greenland, Norwegian and Barents Seas. J. Geophys. Res. 94, 6145 - 6157.
Hyperphysics, 2013. Heat of Fusion, Heat of Vaporization.
http://hyperphysics.phy-astr.gsu.ed/hbase/thermo/phase2.htmlKrümmel D.O., 1891. Die Nordatlantische Sargasso Sea. Map. Scale 1:31300.000. Gotha: Justus Perthes.
http://www.gc.noaa.gov/images/gcil/1891_SargassoSee_Krummel_Petermanns_lores.jpgLevitus et al. 2012. Global Ocean Heat Content. NOAA/NESDIS/NODS Ocean Climate Laboratory. Updated from Levitus et al. 2012. Global Oceanic Heat and Salt Content. In: NOAA National Oceanographic Data Center (NODS), United States Department of Commerce.
http://www.nodc.noaa.gov/OCS/3M_HEAT_CONTENT/Index.htmlLide R., and Frederickse H.P.R., 1995. CRC Handbook of Chemistry and Physics. 75th Edition. 1-1 to 1-33.
Light M.P.R., 2012. Global extinction within one human lifetime as a result of a spreading atmospheric Arctic methane heatwave and surface firestorm. Arctic-News.
http://arctic-news.blogspot.com/p/global-extinction-within-one-human.htmlLight M.P.R., 2013. The Non - Disclosed Extreme Arctic Methane Threat. The 2013 Australian above average temperatures set a record of 0.22oC higher than the 12 month period prior to 2013 and confirm a mid - 21st century atmospheric methane - induced global deglaciation and major extinction event.
https://sites.google.com/site/runawayglobalwarming/the-non-disclosed-extreme-arctic-methane-threatLight M.P.R. 2011a. Use of beamed interfering radio frequency transmissions to decompose Arctic atmospheric methane clouds. Edited by Sam Carana.
http://arctic-news.blogspot.com/p/decomposing-atmospheric-methane.htmlLight M.P.R. 2011c. Stratospheric methane global warming veil. Edited by Sam Carana. In: Arctic News.
http://arctic-news.blogspot.comLight M.P.R., 2012a. Global exctinction within one human lifetime as a result of a spreading atmospheric methane heatwave and surface firestorm. Edited by Sam Carana. In Arctic News.
http://arctic-news.blogspot.comLight M.P.R., 2012b. How much time is there left to act, before methane hydrate releases will lead to human extinction? Edited by Sam Carana. In: Geo-Engineering.
http://Geo-Engineering.blogspot.comLight M.P.R. 2012c. Angels Proposal - A Proposal for the Prevention of Arctic Methane Induced Catastrophic Global Climate Change by Extraction of Methane from beneath the Permafrost/Arctic Methane Hydrates and its Storage and Sale as a Subsidized "Green Gas" Energy Source. LGS. 49 pp. In: Arctic News.
http://arctic-news.blogspot.com.es/2012/05/proposal-to-extract-store-and-sell.htmlLight M.P.R. and Carana, S., 2011. Methane linked to seismic activity in the Arctic. Edited by Sam Carana. In: Arctic News.
http://arctic-news.blogspot.comLight M.P.R. and Solana C., 2002a. Arctic methane hydrates - Mapping a potential greenhouse gas hazard. Abstract and Poster, EGS, Nice.
Light, M.P.R. and Solana, C. , 2002b- Arctic Methane Hydrates: A Potential Greenhouse Gas Hazard
http://adsabs.harvard.edu/abs/2002EGSGA..27.4077LMurphy D.M., Solomon S., Portmann R.W., Rosenlof K.H., Forster P.M., Wong T., 2009. An obervationally based energy balance for the Earth since 1950. Journal of Geophysical Research: Atmospheres (1984 - 2012), Vol. 114, Issue D17, 16 September 2009.
Nuccitelli D., Way R., Painting R., Church J., Cook J., 2012. Comment on "ocean heat content and Earth's radiation imbalance.II Realtion to climate shifts". Physics Letters A. Vol. 376, Issue 45, 1 October 2012, 3466 - 3468.
Rutgers, 2013a. Atlantic Ocean Gyre Map.
http://www.i-cool.org/wp-content/uploads/2010/02/ce058700fg0010.gifRutgers, 2013b. South Atlantic Gyre. I-Cool. International Coalition of Ocean Observing Laboratories.
http://www.i-cool.org/?p=4916Shakova N., 2013. A thawing ocean floor pours methane into the atmosphere and it's only getting worse. PRI. Science. Tech and Environment.
http://www.pri.org/stories/2013-12-12/thawing-ocean-floor-pours-methane-atmosphere-and-its-only-getting-worseSverdrup, Johnson and Fleming, 1942. In; introduction to Physical Oceanography.
http://oceanworld.tamu.edu/resources/ocng_textbook/chapter 11/chapter11_04.htm
http://publishing.cdlib.org/ucpressebooks/view?docId=kt167nb66r&doc.view=popup&fig.ent=http://publishing.cdlib.org/ucpressebooks/data/13030/6r/kt167nb66r/figures/kt167nb66r_fig187.gifWales J., 2013.
- Wikipedia; Gulf Stream.
http://www.en.wikipedia.org/wiki/File:Golfstrom.jpg- Wikipedia; Methane.
http://www.en.wikipedia.org/wiki/Methane- Wikipedia; South Atlantic Gyre
http://www.en.wikipedia.org/wiki/File:South_Atlantic_Gyre.png- Wikipedia; West Spitsbergen Current
http://www.en.wikipedia.org/wiki/West-Spitsbergen-Current- Wikipedia; Sverdrup
http://www.en.wikipedia.org/wiki/SverdrupWeatheronline, 2013.
http://www.weatheronline-co.uk/reports/wxfacts/North-Atlantic-Drift-Gulf-Stream.htm