Showing posts with label runaway global warming. Show all posts

Tuesday, April 1, 2014

Earthquakes in the Arctic Ocean

Earthquakes in the Arctic Ocean
indications of immiment catastrophic methane eruptions?

1. Methane over Greenland

The image below shows high methane concentrations over Greenland and over the Arctic Ocean.

[ Yellow areas indicate methane readings of 1950 ppb and higher - click on image to enlarge ]
The large yellow areas on this image indicate that the methane entered the atmosphere there. This is especially likely when such large yellow areas keep appearing in the same area over a few days. In the case of the large yellow areas around Novaya Zemlya, the methane is likely to have travelled there underneath the sea ice, from the Gakkel Ridge, to enter the atmosphere where the sea ice was thin or fractured enough for the methane to pass through, as discussed in earlier posts.

As described in the post High methane readings over Greenland, huge temperature swings can hit areas over Greenland over the course of a few days. Temperature anomalies may go down as low as as -20°C one day, then climb as high as 20°C a few days laters, to hit temperature anomalies as low as -20°C again some days later.

This could explain the methane over Greenland. Methane is present in the Greenland ice sheet in the form of hydrates and free gas. These huge temperature swings are causing the ice to expand and contract, thus causing difference in pressure as well as temperature. The combined shock of wild pressure and temperature swings is causing movement and fractures in the ice, and this enables methane to rise to the surface and enter the atmosphere.

To further illustrate this, the image below shows recent temperature anomaly forecasts over Greenland.

[ click on image to enlarge ]
2. What is causing these extreme weather events?

Frigid cold weather in the U.S., torrential rain and flooding in the U.K., and wild temperature swings over Greenland. What is causing these extreme weather events? 

As discussed in many previous posts, the Arctic has become warmer than it used to be and temperatures in the Arctic are rising several times faster than global temperatures. This decreases the temperature difference between the areas to the north and to the south of the Jet Stream, which in turn decreases the speed at which the Jet Stream circumnavigates the globe, making the Jet Stream more wavier and increasing opportunities for cold air to descend from the Arctic and for warm air to enter the Arctic.

3. Did temperature swings also trigger earthquakes?

[ click on image to enlarge ]
These wild temperature swings may be causing even further damage, on top of the methane eruptions from the heights of Greenland. Look at the above map, showing earthquakes that hit the Arctic in March 2014.
Topographic map of Greenland
without the Greenland Ice Sheet.

BTW, above map doesn't show all earthquakes that occured in the Arctic Ocean in March 2014. An earthquake with a magnitude of 4.5 on the Richter scale hit the Gakkel Ridge on March 6, 2014.

Importantly, above map shows a number of earthquakes that occurred far away from faultlines, including a M4.6 earthquake that hit Baffin Bay and a M4.5 earthquake that hit the Labrador Sea. These earthquakes are unlikely to have resulted from movement in tectonic plates. Instead, temperature swings over Greenland may have triggered these events, by causing a succession of compression and expansion swings of the Greenland ice mass, which in turn caused pressure changes that were felt in the crust surrounding the Greenland Ice Sheet.

Glaciers could be the key to make this happen. Glaciers typically move smoothly and gradually. It could be, however, that such wide temperature swings are causing glaciers to come to a halt, temporarily, causing pressure to build up over a day or so, to then suddenly start moving again with a shock. Intense cold can literally freeze a glacier in its track, to be shocked into moving again as temperatures rise abruptly by 40°C or so. This can send shockwaves through the ice sheet into the crust and trigger earthquakes in areas prone to destabilization. The same mechanism could explain the high methane concentrations over the heights of Greenland and Antarctica.

Ominously, patterns of earthquakes can be indicators of bigger earthquakes yet to come.

4. Situation looks set to get a lot worse

This situation looks set to get a lot worse. Extreme weather events and wild temperature swings look set to become more likely to occur and hit Greenland with ever greater ferocity. Earthquakes could reveberate around the Arctic Ocean and destabilize methane held in the form of free gas and hydrates in sediments underneath the Arctic Ocean.

Meanwhile, as pollution clouds from North America move (due to the Coriolis Effect) over the Atlantic Ocean, the Gulf Stream continues to warm up and carry warmer water into the Arctic Ocean, further increasing the likelihood of methane eruptions from the Arctic seafloor.


The above image shows the Gulf Stream off the coast of North America, while the image below shows how the Gulf Stream continues, carrying warmer water through the Atlantic Ocean into the Arctic Ocean.


Feedbacks, such as the demise of the Arctic's snow and ice cover, further contribute to speed up the unfolding catastrophe. Methane eruptions from the seafloor of the Arctic Ocean have become especially noticable over the past half year. The big danger is that this will develop into runaway global warming, as discussed in the recent post Feedbacks in the Arctic.

Furthermore, as-yet-unknown feedbacks may start to kick in. As an example, submarine earthquakes and volcanos could add nutrients into the water that feed methane-producing (methanogenic) microbes. A recent study found that expansion of such microbes could have played a large role in the end-Permian extinction, and that it was catalyzed by increased availability of nickel associated with volcanism. Authors support their hypothesis with an analysis of carbon isotopic changes leading up to the extinction, phylogenetic analysis of methanogenic archaea, and measurements of nickel concentrations in South China sediments.

5. Need for comprehensive and effective action

The situation calls for comprehensive and effective action as discussed at the Climate Plan blog.


Related

- Methane Release caused by Earthquakes
http://arctic-news.blogspot.com/2013/09/methane-release-caused-by-earthquakes.html

- Seismic activity
http://arctic-news.blogspot.com/p/seismic-activity.html

- Climate Plan
http://climateplan.blogspot.com


Friday, July 26, 2013

Methane and the risk of runaway global warming

By Andrew Glikson

A satellite picture reveals permafrost melting around Liverpool Bay in Canada’s northwest territories. NASA Goddard Space Flight Center
Research was published this week showing the financial cost of methane being released from Earth’s permafrosts. But the risks go beyond financial – Earth’s history shows that releasing these stores could set off a series of events with calamitous consequences.

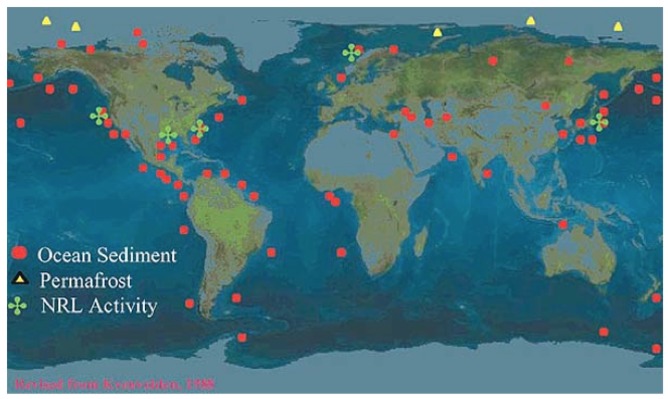
The sediments and bottom water beneath the world’s shallow oceans and lakes contain vast amounts of greenhouse gases: methane hydrates and methane clathrates (see Figure 1). In particular methane is concentrated in Arctic permafrost where the accumulation of organic matter in frozen soils covers about 24% of northern hemisphere continents (see Figure 2a) and is estimated to contain more than 900 billion tons of carbon.

Methane, a greenhouse gas more than 30 times more potent than CO2, is released from previously frozen soils when organic matter thaws and decomposes under anaerobic conditions (that is, without oxygen present).

Most of the current permafrost formed during or since the last ice age and can extend down to depths of more than 700 meters in parts of northern Siberia and Canada. Thawing of part of the permafrost has not yet been accounted for in climate projections.

The Siberian permafrost is in particular danger. A large region called the Yedoma could undergo runaway decomposition once it starts to melt. This is because elevated temperatures cause microbes in the soil to decompose, which causes heat, which creates a self-amplifying process.

Figure 1: Global distribution of methane hydrate deposits on the ocean floor. Naval Research Laboratory

Palaeoclimate studies of stalagmite cave deposits across Siberia indicate they grew faster during the warm periods 424,000 and 374,000 years ago, due to permafrost melt. At that time, mean global temperatures rose by approximately 1.5 degrees Celsius above pre-industrial temperatures. Thus Vaks et al state: “Growth at that time indicates that global climates only slightly warmer than today are sufficient to thaw extensive regions of permafrost.”

Evidence of melting of permafrost has also been reported from the dry valleys of Antarctica, where development of thermokarst (small surface hummocks formed as ice-rich permafrost thaws) has been reported, reaching a rate about 10 times that of the last ~10,000 years.

The mean temperature of the continents has already increased by about 1.5C. With sulphur aerosols masking some of the warming, the real figure may be closer to 2C.

Figure 2a: Vulnerable carbon sinks. CSIRO Global Carbon Project

Figure 2b: Global average abundances of
carbon 
dioxide and methane 1978-2011
Arctic air temperatures are expected to increase at roughly twice the global rate. A global temperature increase of 3C means a 6C rise in the Arctic, resulting in an irreversible loss of anywhere between 30 to 85% of near-surface permafrost. According to the United Nations, warming permafrost could emit 43 to 135 billion ton CO2 (GtCO2) equivalent by 2100, and 246 to 415 GtCO2 by 2200.
The geologically unprecedented rate of CO2 rise (~2.75 ppm/year during June 2012-2013) may result in faster permafrost collapse.

Already measurements along the Siberian shelf uncover enhanced methane release. In 2010 a Russian marine survey conducted more than 5000 observations of dissolved methane showing that more than 80% of East Siberian shelf bottom waters and more than 50% of surface waters are supersaturated with methane. Atmospheric methane levels (during glacial periods: 300–400 parts per billion; during interglacial periods: 600–700 ppb) have recently reached 1850 ppb – the highest in 400,000 years (see Figure 2b).

Hansen et al estimate that the rise of CO2 forcing between 1750 and 2007 has already committed the atmosphere to between +2 and +3 degrees Celsius, currently mitigated in part by sulphur aerosols.

Figure 3: Change in average annual land surface temperature since 1750. Berkeley Temperatures
Hansen refers to the “Venus Syndrome”, drawing an analogy between the enrichment of Venus’ atmosphere in CO2 (its atmosphere is 96.5% CO2 and its surface temperature is 462C) and potential terrestrial runaway greenhouse effects. This needs to be placed in context.

On Earth, weathering processes and oceans draw down the bulk of atmospheric CO2 to be deposited as carbonates. It’s therefore impossible for Earth to develop Venus-like conditions. But the onset of a hyperthermal – a huge release of carbon such as happened during the Paleocene-Eocene Thermal Maximum 55 million years ago, with an attendant mass extinction of species – is possible.

Figure 4. Estimates of fossil fuel resources and equivalent atmospheric CO2 levels, including (1) emissions to date; (2) estimated reserves, and (3) recoverable resources (1 ppm CO2 ~ 2.12 GtC). Hansen, 2012, figure 1; http://www.columbia.edu/~jeh1/mailings/2012/20120127_CowardsPart1.pdf

Extraction and combustion of the current fossil fuel reserves (more than 20,000 billion tonnes of carbon – Figure 4) would inevitably lead to a hyperthermal commensurate with or exceeding the PETM. If that happens, CO2 would rise to above 500ppm (see figure 4), temperature would rise by about 5C (figure 5) and the polar ice sheets would melt – it’s a future we could face if emissions continue to accelerate.

Figure 5: Growth in CO2 and CO2 equivalent (CO2+CH4) during the Pleistocene and the Holocene. IPCC AR4

Not that the above features too much in the Australian elections, where the reality of climate change has been replaced with pseudoscience notions, including by some who have not consulted basic climate science text books, and by hip-pocket-nerve terms such as “carbon tax”, “emission trading scheme” or “direct action”. The proposed 5% reduction in emissions relative to the year 2000 represent no more than climate window dressing.

Nor are coal exports mentioned too often, despite current exports and planned future exports, which represent carbon emissions tracking toward an order of magnitude higher than local emissions.

According to Dr Adam Lucas of the Science and Technology Studies Program at University of Wollongong, Australia (with ~0.3% of the global population) currently contributes domestic emissions of about 1.8% of global emissions. The total domestic and overseas consumption of Australian coal is responsible for more than 2% of global emissions. Plans to triple or even quadruple coal export volumes over the next 10 years would raise Australia’s total contribution to global GHG emissions to toward 9% to 11% by 2020 – an order of magnitude commensurate with that of Middle East oil.

Which places the “Great moral challenge of our generation” in perspective.

Andrew Glikson does not work for, consult to, own shares in or receive funding from any company or organisation that would benefit from this article, and has no relevant affiliations.

The Conversation
This article was earlier published at The Conversation.