Sunday, July 15, 2012

The devaluation of low-cost psychological research


Psychology encompasses a wide range of subject areas,
including social, clinical and developmental psychology, cognitive psychology
and neuroscience. The costs of doing different types of psychology vary hugely.
If you just want to see how people remember different types of material, for
instance, or test children's understanding of numerosity, this can be done at very
little cost. For most of the psychology I did as an undergraduate, data
collection did not involve complex equipment, and data analysis was pretty
straightforward - certainly well within the capabilities of a modern desktop
computer. The main cost for a research proposal in this area would be for staff
to do data collection and analysis. Neuroscience, however, is a different
matter. Most kinds of brain imaging require not only expensive equipment, but
also a building to house it and staff to maintain it, and all or part of these
costs will be passed on to researchers. Furthermore, data analysis is usually
highly technical and complex, and can take weeks, or even months, rather than
hours. A project that involves neuroimaging will typically cost orders of
magnitude more than other kinds of psychological research.


In academic research, money follows money. This is quite
explicit in funding systems that reward an institution in proportion to their
research income. This makes sense: an institution that is doing costly research
needs funding to support the infrastructure for that research. The problem is
that the money, rather than the research, can become the indicator of success. Hiring
committees will scrutinise CVs for evidence of ability to bring in large
grants. My guess is that, if choosing between one candidate with strong
publications and modest grant income vs. another with less influential
publications and large grant income, many would favour the latter.
Universities, after all, have to survive in a tough financial climate, and so
we are all exhorted to go after large grants to help shore up our institution's
income. Some Universities have even taken to firing people who don't bring in
the expected income. This means that cheap cost-effective research in
traditional psychological areas will be devalued relative to more expensive
neuroimaging.


I have no quarrel, in principle, with psychologists doing
neuroimaging studies - some of my best friends are neuroimagers -  and it is important that if good science is to be done in
this area that it should be properly funded. I am uneasy, though, about an
unintended consequence of the enthusiasm for neuroimaging, which is that it has
led to a devaluation of the other kinds of psychological research. I've been
reading Thinking Fast and Slow,
by Daniel Kahneman, a psychologist who has the rare distinction of
being a Nobel Laureate. This is just one example of a psychologist who has made major advances without using brain scanners. I couldn't help thinking that Kahneman would not fare
well in the current academic climate, because his experiments were simple,
elegant ... and inexpensive.


I've suggested previously that systems of academic rewards
need to be rejigged to take into account not just research income and
publication outputs, but the relationship between the two. Of course, some
kinds of research require big bucks, but large-scale grants are not always
cost-effective. And on the other side of the coin, there are people who do
excellent, influential work on a small budget.


I thought I'd see if it might be possible to get some hard
data on how this works in practice. I used data for Psychology Departments from
the last Research Assessment Exercise (RAE), from this website, and matched
this up against citation counts for publications that came out in the same time
period (2000-2007) from Web of Knowledge. The latter is a bit tricky, and I'm
aware that figures may contain inaccuracies, as I had to search by address,
using the name of the institution coupled with the words Psychology and UK. This will miss articles that don't have these words in the address. Also when double-checking the numbers, I  found that for a search by address, results can fluctuate from one occasion to the next. For these reasons, I'd urge readers to treat the results with caution, and
I won't refer to institutions by name. Note too that though I restrict consideration to articles between 2000-2007, the citations extend
beyond the period when the RAE was completed. Web of Knowledge helpfully gives
you an H-index for the institution if you ask for a citation report, and this
is what I report here, as it is more stable across repeated searches than the citation count. Figure 1 shows how research income for a department
relates to its H-index, just for those institutions deemed research active,
which I defined as having a research income of at least £500K over the reporting
period. The overall RAE rating is colour-coded into bandings, and the symbol denotes
whether or not the departmental submission mentions neuroimaging as an
important part of its work. 


Data from RAE and Web of Knowledge: treat with caution!


Several features are seen in these data, and most are
unsurprising:


  • Research income and H-index are positively correlated, r =
    .74 (95%CI .59-.84) as we would expect. Both variables are correlated with the
    number of staff entered in the RAE, but the correlation between them remains
    healthy when this factor is partialled out, r = .61 (95%CI .40-.76).

  • Institutions coded as doing neuroimaging have bigger grants: after taking into account differences in number of staff, the mean income
    for departments with neuroimaging was £7,428K and for those without it was
    £3,889K (difference significant at p = .01).

  • Both research income and H-index are predictive of RAE
    rankings: the correlations are .68 (95% CI .50-.80) for research income and .79
    (95% CI .66-.87) for H-index, and together they account for 80% of the variance
    in rankings. We would not expect perfect prediction, given that the RAE committee
    went beyond metrics to assess aspects of research quality not
    reflected in citations or income. And in addition, it must be noted that the
    citations counted here are for all researchers at a departmental address, not
    just those entered in the RAE.


A point of concern to me in these data, though, is the wide
spread in H-index seen for those institutions with the highest levels of grant
income. If these numbers are accurate, some departments are using their
substantial income to do influential work, while others seem to achieve no more
than other departments with much less funding. There may be reasonable
explanations for this - for instance, a large tranche of funding may have been
awarded in the RAE period but not had time to percolate through to
publications. But nevertheless, it adds to my concern that we may
be rewarding those who chase big grants without paying sufficient attention to
what they do with the funding when they get it.


What, if anything, should we do about this? I've toyed in
the past with the idea of a cost-efficiency metric (e.g. citations divided by
grant income), but this would not work as a basis for allocating funds, because
some types of research are intrinsically more expensive than others. In
addition, it is difficult to get research funding, and success in this arena is
in itself an indicator that the researchers have impressed a tough committee of
their peers. So, yes, it makes sense to treat level of research funding as one indicator
of an institution's research excellence when rating departments to determine
who gets funding. My argument is simply that we should be aware of the
unintended consequences if we rely too heavily on this metric. It would be nice
to see some kind of indicator of cost-effectiveness included in ratings of
departments alongside the more traditional metrics. In times of financial
stringency, it is particularly short-sighted to discount the contribution of
researchers who are able to do influential work with relatively scant
resources.


Friday, July 13, 2012

Communicating science in the age of the internet


© www.CartoonStock.com


Here's an interesting test for those on Twitter. You see a
tweet giving a link to an interesting topic. You click on the link and see it's
a YouTube piece. Do you (a) feel pleased that it's something you can watch or
(b) immediately lose interest. The answer is likely to depend on content, but
also on how long it is. Typically, if I see a video is longer than 3 minutes,
I'll give up unless it looks super-interesting.


Test #2 is for those of you who are scientists. You have to
give a presentation about a recent piece of work to a non-specialist audience.
How long do you think you will need? (a) one hour; (b) 20 minutes; (c) 10
minutes; (d) 3 minutes.


If you're anything like me, there's a disconnect between
your reactions to these different scenarios. The time you feel you need to
communicate to an audience is much greater than the time you are willing to
spend watching others. Obviously, it's not a totally fair comparison: I'm
willing to spend up to an hour listening to a good lecture (but
no more!)
; though to tell the truth, it's an unusual lecturer who can keep
me interested for the whole duration.


Those who use the internet to communicate science have
learned that the traditional modes of academic communication are hopelessly
ill-suited for drawing in a wider audience. TED
talks
have been a remarkably successful phenomenon, and are a million miles
from the normal academic lecture: the ones I've seen are typically no longer than
15 minutes and make minimal use of visual aids. The number of site visits for
TED talks is astronomically higher than, for instance, Cambridge University's
archive of Film Interviews
With Leading Thinkers
, where Aaron Klug has had around 300 hits in just
over one year, and Fred Sanger a mere 148. The reason is easy to guess: many of
these Cambridge interviews last two hours or more. They constitute priceless archive
material, and a wealth of insights into the influences that shape great academic minds, but they aren't suited to the casual viewer.


For most academics, though, shorter pieces pose a dilemma:
they don't allow you to present the evidence for what you are saying. I felt
this keenly when viewing a TED
talk by autism expert Ami Klin
. At 22 minutes, this was rather longer than
the usual TED talk, but Klin is an engaging speaker, and he held my attention
for the whole time. As I listened, though, I became increasingly uneasy. He was
making some pretty dramatic claims. Specifically, as the accompanying blurb
stated: "Ami Klin describes a new early detection method that uses eye-tracking
technologies to gauge babies' social engagement skills and reliably measure
their risk of developing autism". I was very surprised at the claims made
for eye-tracking, and the data shown in the presentation were unconvincing. More
generally, Klin talked about universal screening for 6-month-olds, but I was not sure that he understood the
requirements for an effective screening test
. After the end of the talk I
checked out Klin's publications on Web of Science and couldn't find any
published papers that gave a fuller picture to back up this claim. I asked my
colleagues who work in autism and none of them was aware of such evidence. I
emailed Klin last week to ask if he can point me to relevant sources but so far
I've not had a reply. (If I do, I'll add the information). At the time of writing, his talk has had over 132,000
views.


So we have a dilemma here. Nearly everyone agrees that
scientists should engage with audiences beyond their traditional narrow
academic confines. But the usual academic lecture, saturated with PowerPoint
explaining and justifying every statement, is ill-suited to such an audience.
However, if we reduce our communications to the bottom line, then the audience
has to take a lot on trust. It may be impossible to judge whether the
speaker is expressing an accepted mainstream view. If, as in the Klin case, the
speaker is both famous and charismatic, then it's unlikely that a general
audience will realise that many experts in his field would want to see a lot more hard evidence before accepting what he was saying.


I've been brooding about this issue because I've recently
joined up with some colleagues in a web-based campaign to raise awareness of
language impairments in children. My initial idea was that we'd post lectures
by experts, attempting to explain what we know about the nature, causes, and
impacts of language impairments. Fortunately, we were dissuaded from this idea
by our friends in TeamSpirit, a public relations company who have come on board
to help us get launched. With their assistance, we've posted several videos and
worked out a clearer idea of what our
YouTube channel
should do. We will have professionally produced films that feature
the experiences of young people with language impairments and their families,
as well as the professionals working with them. But we also wanted to ensure
that the material we put out was evidence-based, and to include some pieces on
issues where there were relevant research findings. We were advised that any
piece by a talking academic head should be no more than 3 minutes long. I could
see the wisdom of that, given my own reactions to longer video pieces. But I
was uncomfortable. In 3 minutes, it's impossible to do more than give a bottom
line. I didn't want people to have to take what I said on trust: I wanted them
to have access to the evidence behind it. Well, we're now experimenting with an
approach that I think may work to keep everyone happy. Our academic-style talks
will stick to the 3 minute limit, but will be associated with a link to a PowerPoint
presentation which will give a fuller account. This is still shorter than the
usual academic talk - we aim for around 15-20 slides, all of which should be
self-explanatory without needing an oral narrative. And, crucially, the PowerPoint
will include references to peer-reviewed research to support what is said, and
will include a link to a reference list, including where possible a review
article. I anticipate that most people who visit our YouTube site will only get
as far as the 3 minute video. That's absolutely fine - after all, only a small
proportion of potential visitors will be evidence geeks. But, importantly, the
evidence will be there for those who want it. The PowerPoint will give the bare
bones, and the references will allow people to track back to the original
sources.


We live in exciting times, where it has become remarkably
easy to harness the power of the internet to disseminate research. The
challenge is to do so in a way that is effective while preserving academic
rigour.

Saturday, June 30, 2012

Schoolgirls' health put at risk by Catholic view on vaccination


Today's Time Newsfeed carries a remarkable story: parents of children attending Catholic schools in Calgary were sent a special letter to accompany details of a vaccination programme against human papillomavirus (HPV), which protects against cervical cancer. In it, local bishops wrote: "Although school-based immunization delivery systems generally result in high numbers of students completing immunization, a school-based approach to vaccination sends a message that early sexual intercourse is allowed.”
I find this amazing for several reasons:


  • There's a complete failure to understand what affects teenagers' behaviour. Do the bishops seriously think that teenaged girls who are thinking of having sex say to themselves "Oh, wait a minute. I might get HPV. Let's not do it." Potential consequences of sex include a host of sexually transmitted diseases, as well as pregnancy. If these don't put girls off, then why should a risk of HPV? 

  • HPV is a sexually transmitted disease. You can get it if you are a virgin who marries someone with HPV. You can get it if you are raped (something which has been known to occur in Catholic schools). 

  • The recommendation seems theologically dubious. I'm an atheist, but my understanding of Catholicism is that whether or not something is a sin is largely to do with motivation rather than action. So if you are tempted to sex but desist because it would upset God, then that's good. If you are tempted to sex but desist only because of a fear of disease, that's still a sin. The church should be teaching girls to love God so much that they won't do things that offend him, not to conform to standards of sexual behaviour out of fear. No doubt religious readers will put me right if I've misunderstood this distinction. 

  • These girls are attending a Catholic school where I assume morality is
    drummed into them day and night. The bishops assume that their grasp of
    that morality is so weak that having a HPV vaccination will be
    sufficient to overturn everything they have been told about sexual
    ethics. Doesn't say much for the religious teaching in the schools, or for the intelligence of the pupils. 

  • One thing Jesus really understood is that humans aren't perfect and frequently fall short of the moral standards they try to adhere to. There's a huge emphasis on forgiveness of sin in his teachings. The Bishops are in effect saying that God won't forgive you if you stray from the straight and narrow: he'll commit you to a life with an unpleasant disease, and increase your risk of dying from cancer. That's not the Christian God I was taught about.


Sunday, June 24, 2012

Causal models of developmental disorders: the perils of correlational data


Experimental psychology depends heavily on statistics, but
psychologists don’t always agree about the best ways of analyzing data. Take
the following problem:


I have two groups each of 30 children, dyslexics and
controls. I give them a test of auditory discrimination and find a significant
difference between the groups, with the dyslexic mean being lower. I want to
see whether reading ability is related to the auditory task. I compute the
correlation between the auditory measure and reading, and find it is .42, which
in a sample of 64 cases is significant at the .001 level.


I write up the results, concluding that poor auditory skill
is a risk factor for poor reading. But reviewers are critical.
So what’s wrong with this?


I’ll deal quickly with two obvious points. First, there is
the well-worn phrase that correlation does not equal causation. The correlation
could reflect a causal link from auditory deficit to poor reading,
but we need also to consider other causal routes, as I’ll illustrate further
below. This is an issue about interpretation rather than data analysis.


A second point concerns the need to look at the data rather
than just computing the correlation statistic. Correlations can be sensitive to
distributional properties of the data and can be heavily influenced by
outliers. There are statistical ways of checking for such effects, but a good
first step is just plotting a scatterplot to see whether the data look orderly.
A tip for students: if your supervisor
asks to see your project data, don’t just turn up with numerical output from
the analysis: be ready to show some plots.


Figure 1: Fictitious data showing spurious correlation between height and reading ability


A less familiar point concerns the pooling of data across
the dyslexic and control groups. Some people have strong views about this, yet,
as far as I’m aware, it hasn’t been discussed much in the context of
developmental disorders. I therefore felt it would be good to give it an airing
on my blog and see what others think.


Let’s start with a fictitious example that illustrates the
dangers of pooling data from two groups. Figure 1 is a scatterplot showing the
correlation between height and reading ability in groups of 6-year-olds and
10-year-olds. If I pool across groups, I’m likely to see a strong correlation
between height and reading ability, whereas within any one age group the
correlation is negligible. This is a clear case of spurious correlation, as
illustrated in Figure 2. Here the case against pooling is unambiguous, and it's
clear that if you look at the correlation within either age band, there is no
relationship between reading ability and height.


Figure 2: Model showing how a spurious correlation between height and reading arises because both are affected by age


Examples such as this have led some people to argue that you
shouldn’t pool data in studies such as the dyslexic vs. control example. Or, to
be more precise, the recommendation is usually that you should check the
correlations within each group, and
avoid pooling if they don’t look consistent with the pooled correlation. I’ve
always been a bit uneasy about this logic and have been giving some thought as
to why.


First, there is the simple issue of power. If you halve your
sample size, then you increase the standard error of estimate for a correlation
coefficient, making it more likely that it will be nonsignificant. Figure 3
shows the 95% confidence intervals around a correlation of .5 depending on
sample size, and you can readily see that these are larger for small than big
samples. There's a nice website by Stan
Brown
that gives relevant formulae in Excel.


Figure 3: 95% confidence interval around estimated correlation of .5, with different sample sizes


A less obvious point is that the data in Figure 1 look
analogous to the dyslexic vs. control example, but there is an important
difference. We know where we are with age: it is unambiguous to define and measure.
But dyslexia is more tricky. Suppose we substitute dyslexia for age, and
auditory processing for height, in the model of spurious correlation in Figure
2. We have a problem: there is no independent diagnostic test for dyslexia. It
is actually defined in terms of one of our correlated variables, reading
ability. Thus, the criterion used to allocate children to groups is not
independent of the measures that are entered into the correlation. This creates
distortions in within-group correlations, as follows.


If we define our groups in terms of their scores on one
variable, we effectively restrict the range of values obtained by each group,
and this lowers the correlation.  Furthermore, the restriction will be less for
the controls than for the dyslexic group - who are typically selected as
scoring below a low cutoff, such as one SD below the mean. Figure 4 shows simulated
data for two groups selected from a population where the true correlation
between variables A and B is .5. Thirty individuals (dyslexics) are selected as
scoring more than 1 SD below average on variable A, and another 30 (controls)
are selected as scoring above this level. 


Figure 4: Correlations obtained in samples of dyslexic (red) and controls (blue) for 20 runs of simulation with N = 30 per group.


The Figure shows correlations from twenty
runs of this simulation. For both groups, the average correlation is less than
the true value of .5, because of the restricted range of scores on variable A.
However, because the range is more restricted for the dyslexic group, their
average correlation is lower than that of the controls. A correlation of .42 corresponds to the .05 significance level for a sample of
this size, and we can see that the controls are more likely to exceed this
value than the dyslexic group. All these results are just artefacts of the way
in which the groups were selected: both groups come from the same population
where r = .5.


What can we conclude from all this? Well, the bottom line is
that if we find non-significant within-group
correlations this does not necessarily invalidate a causal model. The
simulation shows that we may find that within-group correlations look quite
different in dyslexic and control groups, even if they come from a common
distribution.


So where does this leave us?! It would seem that in general,
within-group data are unlikely to help us distinguish between causal and
non-causal models: they may be compatible with both. So how should we proceed?


There’s no simple solution, but here are some suggestions:


1. If considering correlational data, always report the 95%
confidence interval. Usually people (including me!) just report the correlation coefficient,
degrees of freedom and p-value. It’s so uncommon to add confidence intervals
that I suspect most psychologists don’t know how to compute it. Do not assume
that because one correlation is significant and another is not that they are
meaningfully different. This
website
can be used to test for the significance of the difference between
correlations. I would, however, advise against interpreting such a comparison
if your data are affected by the kinds of restriction of range discussed above.


2. Study the relationship between key variables in a large unselected
sample covering a wide range of scores. This is a more tractable solution, but
is seldom done. Typically, people recruit an equivalent number of cases and
controls, with a sample size that is inadequate for getting a precise estimate
of a correlation in either group. If your underlying model predicts a linear
relationship between, say, auditory processing and phonological awareness, then
with a sample of 200 cases, a fairly precise estimate can be obtained. With this approach, one
can also identify whether the relationship is linear.


3. More generally, it’s important to be explicit about what
models you are testing. For instance, I’ve identified four underlying models of
the relationship between auditory deficit and language impairment, as shown in Figure
5. In general, correlational data on these two skills won’t distinguish between
these models, but specifying the alternatives may help you think of other data
that could be informative. 


Figure 5: Models of causal relationships underlying observed correlation between auditory deficit and language impairment


For instance:


  • We
    found that, when studying heritable conditions, it is useful to include
    data on parents or siblings. Models differ in predictions about how
    measures of genetic risk - for instance, family history, or presence of
    specific genetic variants - relate to A (auditory deficit) and B (language impairment) in the child. This approach is
    illustrated in this
    paper
    . Interestingly, we found that the causal model that is often implicitly assumed, which we termed the Endophenotype model, did not fit the data, but nor did the spurious correlation model, which corresponds here to the Pleiotropy model.

  • There
    may be other groups that can be informative: for instance, if you think
    auditory deficits are key in causing language problems, it may be worth
    including children with hearing loss in a study - see this
    paper
    for an example of this approach using converging evidence.

  • Longitudinal
    data can help distinguish whether A causes B or B causes A.

  • Training
    studies are particularly powerful, in allowing one to manipulate A and see
    if it changes B.


So what’s the bottom line? In general, correlational data
from small samples of clinical and control groups are inadequate for testing
causal models. They can lead to type I errors, where pooling data leads to a
spurious association between variables, but also to type II errors, where a
genuine association is discounted because it isn’t evident within subject
groups. For the field to move forward, we need to go beyond correlational data.


P.S. 9th July 2012

I've written a little tutorial on simulating data using R to illustrate some of these points. No prior knowledge of R required. see: http://tinyurl.com/d2868cg


Bishop DV, Hardiman MJ, & Barry JG (2012). Auditory deficit as a consequence rather than endophenotype of specific language impairment: electrophysiological evidence. PloS one, 7 (5) PMID: 22662112


If you liked this post, you may also be interested in my other posts on statistical topics:

Getting genetic effect sizes in perspective
The joys of inventing data
A short nerdy post about the use of percentiles
The difference between p < .05 and a screening test

Monday, June 4, 2012

The ‘autism epidemic’ and diagnostic substitution


Based on: King &
Bearman (2011) American Sociological Review, 76(2), 320-346; 


Data from birth
and diagnostic records for all children born in California 1992-2000


Everyone agrees there has been a remarkable increase in
autism diagnosis across the world. There is, however, considerable debate about
the reasons for this. Three very different kinds of explanation exist.


  • Explanation #1 maintains that something in our modern environment has come
    along to increase the risk of autism. There are numerous candidates, as indicated in this blogpost by Emily Willingham. 

  • Explanation #2 sees the risks as largely biological or genetic, with changing
    patterns of reproduction altering prevalence rates, either because of
    assortative mating (not much evidence, in my view) or because of an increase in
    older parents (more plausible). 

  • Explanation #3 is very different: it says the
    increase is not a real increase - it’s just a change in what we count as
    autism. This has been termed ‘diagnostic substitution’ - the basic idea is that
    children who would previously have received another diagnosis or no diagnosis are
    now being identified with autism spectrum disorder (ASD). This could be in part
    because of new conceptualisations of autism, but may also be fuelled by
    strategic considerations: resources for children with ASD tend to be much
    better than those for children with other related conditions, such as language
    impairment or intellectual handicaps, so this diagnosis may be preferred.


In 2008, my research group published a study that
documented one kind of diagnostic substitution. We contacted people who had
taken part in our studies of children with specific language impairment years
ago. We carried out a standard diagnostic observation procedure for autism with
the young adults themselves and, where possible, interviewed their parents
about their early history. We found a number of individuals who had been
regarded as cases of specific language impairment ten or twenty years ago but who
would nowadays be diagnosed with ASD. Although it’s possible that some people
develop autistic symptomatology as they get older, in our cases the autistic
symptoms appeared to have been present from early childhood - as indicated by
the parental interviews. Around half of the sample had been identified as having
‘semantic-pragmatic disorder’ in childhood, but autism had been excluded because
at that time, prior to publication of DSM-IV diagnostic guidelines, it was
regarded as a very rare condition in which there were severe social and
behavioural impairments. How many children would have qualified for ASD
diagnoses had they been seen today? Well, it depends. I suspect few people
appreciate just how flexible the diagnostic criteria are for autism, even when lengthy standardized diagnostic instruments are used. Although we used the gold
standard diagnostic procedures (ADOS-G and ADI-R) we found they seldom gave the
same answer. If we diagnosed ASD only when both diagnostic instruments agreed,
21% of cases met criteria. If we included anyone who met criteria for autism or
PDDNOS on either ADI-R or ADOS, the rate shot up to 66%.


Last year, a fascinating study by Brugha and colleagues attacked the same question from a different angle. They did an epidemiological
survey of a representative sample of adults from the English population, using
the ADOS-G, and found that the rates of ASD were similar to those recently
reported in children. Within the adult population, rates of ASD did not change
with age. Thus, provided we stick to the same diagnostic criteria, then the
prevalence of autism is the same for those born several decades ago, as it is
for the current generation of children. Importantly, none of these adults with
ASD had received a formal diagnosis.


Recently, we conducted a study with another group: children with an additional sex chromosome (i.e. trisomy). We had not intended to study
diagnostic substitution: the goal was rather to understand more about the
language difficulties that had previously been described in children with sex
chromosome trisomies. The effect of an extra sex chromosome is relatively mild:
most of these children attend mainstream schools and they do not have any
obvious physical abnormalities. Indeed, they can be hard to study because many
individuals with trisomies will be unaware of their condition. We gathered
information by parental report, and did not do any direct evaluation of the
child, but we did ask about whether the child had had any kind of diagnosis by
a medical or psychological expert. We confirmed that there was a strong
association with language problems in all three kinds of trisomy (girls with
XXX, and boys with XYY or XXY), many of whom had had speech-language therapy.
But we also found that 2/19 (11%) of boys with XXY and 11/58 (19%) of those
with XYY had received an ASD diagnosis.


It is important to emphasise that most children with a sex
chromosome trisomy did not have an ASD diagnosis, and many were not giving any
cause for concern. Nevertheless, although they are only a minority of cases,
the proportion with ASD is much higher than in the general population. We were
really surprised at this because before publishing our study we had done a
systematic review of the literature on children with sex chromosome trisomies,
focusing on studies that avoided ascertainment bias. In these studies, not a
single case of autism had been mentioned when discussing outcomes. So was our
study a fluke? We are confident this is not the case, because this year two
further studies from the USA
have been reported (Ross et al and Lee et al, in press), both of which got results very similar to ours, though
using different methods.


This research provides further evidence that diagnostic
substitution has occurred, suggesting that children who in the past would have
been diagnosed with language impairment are now being diagnosed with ASD. The
only other way to explain the increased diagnosis rate in children with a known
chromosomal abnormality would be if the trisomy acted as a risk factor, making
children more sensitive to environmental factors that could cause autism. That’s
a possibility, but it seems more likely that cases of ASD were missed in the
past because more stringent diagnostic criteria were used, just as was found in our follow-up of children with SLI and in the epidemiological study
of adults by Brugha and colleagues.


It is becoming clear that changing diagnostic criteria,
increased awareness of ASD, and strategic use of diagnosis to gain access to
services, have had a massive effect on the numbers of children with ASD. When I
started studies in this area, I thought diagnostic substitution had happened
but I did not think it would be sufficient to explain the increase in numbers of ASD
diagnoses. But now, on the basis of studies reviewed here, I think it could be
the full story.


PS: a slightly extended version of this blogpost was featured on PLOS Blogs on 8th June 2012.


References

Bishop, D., Jacobs, P., Lachlan, K., Wellesley, D., Barnicoat, A., Boyd, P., Fryer, A., Middlemiss, P., Smithson, S., Metcalfe, K., Shears, D., Leggett, V., Nation, K., & Scerif, G. (2010). Autism, language and communication in children with sex chromosome trisomies Archives of Disease in Childhood, 96 (10), 954-959 DOI: 10.1136/adc.2009.179747


Bishop, D., Whitehouse, A., Watt, H., & Line, E. (2008). Autism and diagnostic substitution: evidence from a study of adults with a history of developmental language disorder Developmental Medicine & Child Neurology, 50 (5), 341-345 DOI: 10.1111/j.1469-8749.2008.02057.x


Brugha, T. (2011). Epidemiology of Autism Spectrum Disorders in Adults in the Community in England Archives of General Psychiatry, 68 (5) DOI: 10.1001/archgenpsychiatry.2011.38


Lee, N. R., Wallace, G. L., Adeyemi, E. I., Lopez, K. C., Blumenthal, J. D., Clasen, L. S., & Giedd, J. N. (2012, in press). Dosage effects of X and Y chromosomes on language and social functioning in children with supernumerary sex chromosome aneuploidies: Implications for idiopathic language impairment and autism spectrum disorders. Journal of Child Psychology and Psychiatry. 


Ross, J. L.,et al (2012). Behavioral and social phenotypes in boys with 47, XYY syndrome or 47, XXY Klinefelter syndrome.  Pediatrics, 129(4), 769-778. doi: 10.1542/peds.2011-0719


Monday, May 21, 2012

Well, this should be easy….


 Life and times of an amateur video-maker


It’s been an exciting week. On Friday, a small group of us
launched a campaign to raise awareness of children’s language learning
impairments (RALLI). We’ve
been fortunate to have had considerable help from TeamSpirit, an agency
whose expertise in marketing and advertising has been invaluable. With their
assistance, we’ve set up a YouTube channel, which has kicked off with some
professionally-made video shorts to introduce the campaign. But we don’t have
funds to continue with a lot of expensive professional services, and so our
plan is to post a mix of content on the site, including some videos made by the
RALLI team. We are four academics and a speech-and-language therapist, none of
whom has any expertise in filming, but the TeamSpirit folks were reassuring.
What we needed was a digital flipcam, which would allow us to film ourselves in
high definition video, download to the computer, and upload to YouTube. Easy
peasy. Or so I thought. Before I began this exercise, I was a straightforward
atheist. Now I believe in supernatural forces, but they aren’t benign.


The camera arrived in the post and looked great - same size
as a mobile phone. I studied the manual. There was a battery. There was a slot
labelled ‘battery compartment’. But there was a problem. The battery did not
fit in the battery compartment, whichever way I tried. I grumbled to my PA that
we’d been sent the wrong battery. She discovered a bit of the manual that
explained how to insert the battery - in a quite different place. I left her to
play with the camera while I went off to prepare a lecture, as she was clearly more
suited to this than me. She emailed me to say that the camera worked well, but
there was a snag. It stored exactly 30 seconds of footage. Should you want more
than this, you had to buy a memory card. This is what went in the ‘battery
compartment’. So, my plans for starting filming were foiled.


Onto the Kodak website. Astounded by how much I’d have to
pay for a memory card. Realised I’d also need some kind of tripod to stabilise
the camera when filming myself. Registered on the website, put in an order, tried
to pay with Paypal, password rejected. Having assumed various emails from
Paypal were spam, I was now uncertain as to whether or not my recorded password
was still valid. But I wasn’t going to get a chance anyhow, as my failed
password had somehow aborted the whole operation. Too busy to start again, so
decided I’d take a look in Currys to see if I could buy memory etc.


The Currys option was the only positive thing to happen.
Found a dinky little cushion thing that you could screw your camera into that
cost far less than a tripod and worked as well. Also found that, as I didn’t
plan to record hours of footage, I could buy a small memory card much more
cheaply. So I was ready to go except for one thing. I needed an external
microphone.


We had had a clearout of our lab a few months ago, during
which we’d found a huge cache of microphones. For years we did research on
language disorders that involved making good quality tape-recordings of
children, and we had clip-on microphones, boundary microphones, big
microphones, small microphones, none of which had been used for years. However,
they had all been carefully put away. Somewhere. I thought I was getting close
when I found a box full of headphones, but no. Several boxes later, I gave up. I
wonder if other people have boxes full of cables that connect together things
that you have never used, have no idea what they’re for, but can’t bear to
throw away.


Eventually, a savvy member of my team arrived and located a boundary
microphone, which I took home with me to experiment with over the weekend.
Well, I guess this microphone had once been good, but it had lived in a box for
about 8 years. I assumed that the little round battery in it was now well dead,
but there were a couple of spare batteries still in their original packaging.
Like most contemporary packaging, this  was designed to give you the
impression that if you attack it with fingernails, you might get in, when in
fact this is not the case. The only result is a broken fingernail. What is
needed is scissors, and so I now went on a scissor-hunt. Eventual success,
though why scissors should be in the fruit bowl I do not know.  


No indication as to which way round the battery should go,
and I’d made the mistake of removing the existing one without checking. Tried
new battery one way up. Nothing. But now a problem. The battery sat happily in
the battery hole and did not want to come out. Tried fingernails, tried
prodding with nail-scissors. It wobbled, but it wouldn’t budge. Gave to
husband. He tried fingernails, and tried scissors. Then he had a remarkable
insight. “What we need,” he said, “is a magnet”. This seemed to me no more than
a theoretical speculation of no practical relevance. But he went further, and
demonstrated his true genius in lateral thinking. “We need the little red man.”
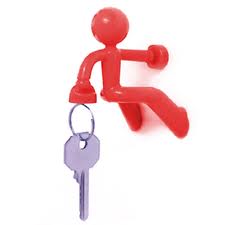
The little red man is a fridge magnet that we’d been given for Christmas. Downstairs
to the kitchen again. The red man’s magnetic feet proved to be the perfect size
for extracting little round batteries from microphones. We removed the battery.
We rotated the battery. We reinserted the battery and plugged the microphone
into the flipcam. Made a recording. Couldn’t hear any sound. What we now
needed, clearly, was headphones. Headphone-hunt ensued. Headphones eventually
located in the bedroom. Plugged in. Well, there was sound, but it was very
faint. I tried modifying the controls on the flipcam to improve the gain, but
that had  minimal effect. Here my amateur
knowledge of technology failed me. If it was faint, could it mean that the
battery was running out of juice? Husband thought unlikely but we did have one
more spare battery to try. Another assault on packaging with scissors and we
were in. We had another go with red Pete’s feet, but the new battery didn’t
work at all. At this point it was getting late and husband was impatient to
watch another episode of Breaking Bad (highly recommended: we are on series 3),
so I gave up for the night.


Next morning decided to look in the geological specimen
cabinet to see if I could find an alternative battery. This is an amazing piece
of furniture that we picked up in a country auction about 30 years ago. Its
original function was to store bits of rock, but it is a godsend for a hoarder,
as it allows you to hoard your useless objects in labelled mahogany drawers.
One drawer is called Batteries. The problem is that the batteries that live in
it tend to be very old, but I did find some that were small and round and
labelled as “For use only in NHS hearing aids.” Husband, who has a hearing aid,
denied all knowledge of them. Ever optimistic, I decided to try one in my
microphone, feeling ever-so-slightly wicked at disobeying the stern injunction
on the packet. The battery fitted in the microphone slot very snugly. I tried
recording. I got a signal, but it was even weaker than before. Oh well, I
thought, maybe I should just buy a new battery. But then I had a problem. The
snugly fitting NHS battery was wedged in. Even the full force of red Pete’s
feet would not budge it. I felt that God was punishing me for misappropriating
NHS property and sadly decided that the boundary microphone would have to be
ditched, and I should just get myself a clip-on microphone (which was what
TeamSpirit had originally recommended….).


Off I trotted to Currys. “No”, they said, “We don’t do
microphones. You could try Maplins on the Botley Road.” This entailed a trip in the
car, but, after standing for 10 minutes in a queue while the extraordinarily
helpful Maplin’s staff explained some complicated electronic device to a
customer, I was armed with my microphone and ready to go. Quick test when I got
home and it worked! Excellent clear signal. So I should be able to make the two
short video clips that I had undertaken to do.


Now my only problem was to perfect a three-minute spiel and
record myself saying it in front of the camera. Well, there was another
problem, which is that my usual weekend appearance is scruffy. I do scruffy
very well. It’s my natural state. But if I was going to be recorded for
posterity, I needed to try and look professional. I realised that only my top
half would be visible, so put on smart top, jewellery and make-up. Husband
wandered in at some point: surprised to see me dressed up but clearly thought I
had just forgotten to change from
track-suit trousers, which says much about my usual level of absent mindedness.
Arranged camera on a stepladder to capture head-and-shoulders region, checked
light levels, sat in chair, breathed in ready to start spiel, and … the phone
rang. Blood transfusion service, wanting me to make an appointment to give
blood. Go downstairs, find diary, make appointment. Start again.


The thing about talking in front of a video for three
minutes is that it’s quite easy to do it for about two minutes, but then you
snarl up. I had two takes that were near-perfect but where I then descended
into gibberish. There was also one take where the top of my head was chopped
off, and another where I forgot to plug in the microphone. But eventually, I
had a version with just a minor stumble in the middle which I decided I could
live with. So now, I just had to import it into my computer. Quick hunt for the
instruction manual, eventually located underneath a newspaper. Cunningly
designed camera has USB connector that you can pull out of slide slot: neat!
You put it in your computer, which allows you to download the software that you
need to edit your video. This gives instructions for yet other software that
you need to find on the web. You download that and restart the computer as
instructed. You then get a cheerful message to tell you that there’s a new
version of your software, and would you like to download an update now. “No I
would not!” I say sternly to the screen, determined to press on now I’ve got
started. I’m confused as to the distinction between the two bits of software,
but eventually manage to download my video. It’s looking good. Except the audio
starts about three seconds before the video. I try again. Same story. I look at
video on the camera: audio and video perfectly synchronised.


Decide I need coffee, but we are out of coffee, so nip
across the road. Weird look from shopkeeper reminds me that I am make-up and
jewellery on top half and tracksuit on bottom half. Coffee in hand, I regroup.
No advice on out-of-sync films in the manual or on the website of the
camera-maker, which is complex, confusing and looks unlikely to resolve my
problems.  Try Google. There seem to be
only a tiny handful of people out there who’ve had the same problem, and the
replies they’ve had are not encouraging. One man had shot 20 hours of film
before realising the problem, so I reckoned I was lucky in comparison to him.
One suggestion to him was to get into an editing program that would allow him
to shuffle along the audio track.  I
dimly remember using some video editing software in the past that allowed me to
separate the audio and video stream on a file. Hunt through all my software,
and locate Windows Moviemaker. This is encouraging, except it doesn’t seem able
to read mp4 files.


In the back of my mind, there’s a concern that maybe the
problem is due to the microphone. Now, this is what happens to me when I
encounter a succession of obstacles: I start calm and logical, but I then start
to think that there’s a malign force out there chuckling over my misfortunes,
and I lose the plot and move over to magical thinking. If the problem was the
microphone, then my logical brain tells me that the video should be out of sync
when viewed on the camera. But a little voice in my head is telling me I should
try with a different microphone, and so off I go on a futile and time-consuming
exercise. I have another microphone that’s attached to a headset. So I unplug
the recorder from the computer USB port. In response, computer gives me blue
screen of death. Switch off computer. Reboot. Relieved to find it still works
okay.


So I return upstairs to my living room to record two new
brief segments, one with original microphone and one with headset microphone. I
come downstairs, I plug camera into USB port. Blue screen of death returns.
Reboot computer. It won’t start. Realise that this might be due to camera in
USB port. Remove camera. Computer starts OK. Gingerly put camera in USB port.
This time it’s okay, and I download my two trial clips. Both download okay. But
when I play them, I realise there’s a fatal flaw to my test. I recorded clips
with me talking, but did not record my face. So I have no idea whether or not
the audio is in sync with the video.


Upstairs again to re-record. Ultimately, this futile test
confirms that both microphones give an in-sync film on the camera, which
mysteriously transforms into an out-of-sync version on my computer.


I have a faint memory of things called codecs, which
determine how audio and video is converted into a digital form. Maybe I don’t
have the right codecs. At this point, a more sensible test occurs to me. I
should try downloading on to a different computer. Husband who is peacefully
working in his office at top of the house is willing to lend me a laptop, which
I carry to my office at bottom of house. It takes a very long time to boot up,
and once it’s done that, I can’t get the mouse to work. Try pressing buttons
etc. No joy. Further consultation with husband. Decide to replace battery in
mouse. We have batteries, but they are defended by packaging. Further hunt for
scissors. Get battery. Replace battery. Mouse now works. Plug in camera.
Download software. Restart. Get message telling me to download updated software
and decide this may be a good idea, so do that and again restart. This is a
computer that takes a good 5 minutes to boot up and to shut down. Make a cup of
tea while all this is going on. And, joy oh joy, when I have got software
installed and downloaded the video, it works. It is in sync! I have to edit it
to chop off the first and last bits, where I am walking from the camera to the
chair and back, and so I find the manual which explains how to do that, but I’m
in a hurry, as we are going out for the evening, and somehow, I manage to do
the opposite of what I intended, so am left with just the end of the film,
which is a bit I wanted to discard. Still, I think, we’re getting there.
Tomorrow is another day.


A new day dawns. I download the film to husband’s computer
one more time. This time I do succeed in selecting the right portion to save,
and create a file that we’ll be able to download to YouTube. But I’d really
like to back it up on my computer, and there’s a problem. It’s too big to
email, too big for Dropbox, and won’t fit on a memory stick. I used to have
several pocket drives, but I blew up a couple of them by using the wrong power
supply, and the others are at work. Hunt of the house eventually yields a
pocket driving belonging to husband (who is amassing marital points at an
unprecedented rate during this exercise) and transfer the video to my computer.
But when I play it, the audio is out of sync with the video.


Now, although this is disappointing, I’m not sure whether
it’s good news or bad news. The good news is that the file is clearly fine when
played on either the camera or my husband’s PC. So the problem is with my PC
and how it is interpreting the file. So I feel I have to get to grip with
codecs again. The software has actually told me which codecs were used with the
file, and I make a note of them. Googling the IDs leads me to a website that
has oodles of codecs that you can download. A bit more Googling allows me to
find out how to see which codecs are already installed on my machine. But now I
have a quandary. It’s not clear to me that the codec download site is safe, and
a bit more Googling confirms my worries. It seems that you can end up far worse
than you started if you download a dodgy codec. So I have a new idea. I’ll try
the Microsoft site and see what it says about codecs. What it says is possibly the
least helpful advice I have ever seen. It suggests you search on the internet
for the codecs you need, but it then says that it can be really, really
dangerous to download codecs from the internet, and warns you against it.


Well, I think, maybe if I download an up-to-date version of
Moviemaker, it might come with useful codecs. On to the Microsoft site. Yes,
there’s a more recent version of Moviemaker, and I initiate the download
process. But then it demands verification via Microsoft Genuine Advantage. This
rings faint bells as something I decided not to sign up for, having read
reviews that suggested it could slow up your machine. I think that maybe I
should give it a try, but when I try to do so I ultimately get to a website
that explains that the page isn’t working and Microsoft is aware of the
problem.


I decide that, rather than wasting time on a fruitless hunt
for a safe codec, I will shoot one more bit of footage. Once again, make-up,
nice top, pearls. Part of me wonders whether there’s any point to this, and
whether I should not instead adopt the Mary Beard approach of appearing au
naturel. It definitely works for Mary, who is widely adored for her robust
attitude to those who think she should have a make-over for TV. But I decide
that I can’t now change tack, as it would really look weird if one bit of view
had me all glammed up and the next one had the normal scruffy Bishop. The first
two takes are fluffed, but the third is perfect. Except that when I try to stop
the recording, the device is frozen. No buttons at all work, even the off
switch. I’m starting to get emotional but have to try not to cry as it would
just make my makeup run (another good reason for adopting the au naturel
approach). The manual is singularly unhelpful - its advice on problems is
restricted to occurrences such as having one’s finger in front of the
viewfinder. Googling doesn’t help either. All my experiences seem unique to
me  - further evidence of the malign
force. Only solution, I guess, is to remove the battery. That restores the
camera to normal functioning, but the last, perfect, take is described as “file
type unknown”.


Back upstairs for yet another session. Eventually manage a
version that seems okay, which I download successfully. And which looks fine on
husband’s laptop but out-of-sync on mine. Thankfully get back into tracksuit,
remove makeup, and decide I will reward myself with a negroni and an episode of
the Bridge.


If these videos do ever get onto the RALLI site, you may
think that I look a bit stressed for someone who’s just doing a three-minute
piece. But now you know the true story.


Sunday, May 6, 2012

Sharing of MRI dyslexia datasets


One of the great things about blogging is that it allows for communication to proceed far more rapidly than would be possible through conventional academic publications. In previous posts I’ve
made a plea for MRI researchers to share data so that claims about the
neurobiology of conditions such as dyslexia
and autism
can be replicated. After my last blogpost, I was contacted by Mark Eckert from
the Medical University of South Carolina, one of the pioneers of MRI studies of dyslexia (e.g. Eckert et al, 2005). He tells me that a data-sharing
project on dyslexia is already underway and asked if I would be able to share this information with my followers. I am of course delighted to do so! Here is some background from Mark:


The
structural neuroimaging literature on dyslexia and other complex disorders is
filled with inconsistent results. 
Meta-analysis provides a mechanism for identifying results that are
common across studies, but direct analysis of the same datasets provides
greater power, methodological consistency, and new analysis opportunities that
include taking advantage of the behavioral and neural heterogeneity that is
often problematic in small samples.  For
those reasons, there is a growing interest in sharing data.  Prospective multi-site studies are ideal
because the same data collection and quality control procedures can be used
across sites.  These studies tend to be
very expensive, however.  Retrospective
studies take advantage of existing datasets that are housed in dusty hard
drives, but are limited by methodological inconsistencies across sites.  A new NIH supported project, directed by Mark Eckert,
uses dyslexia as a model to address the challenges facing retrospective
multi-site studies.  Methods are being
developed in this project to address subject privacy,
behavioral heterogeneity in dyslexia and control samples, missing data, and the
underestimation of the variance in datasets when pooling data across different
research sites.  His research group is
collecting existing neuroimaging datasets and aims to have more than 2000
pediatric and adult cases from reading disability studies.  One long term goal of this project is to make
available much of the data collected for this study so that scientists can ask
new questions, apply new methods to the data, and develop new collaborations
with other scientists who have complementary expertise and interests in reading
disability.  There are incentives for
research groups to contribute data. For example, contributors will be included
in a Dyslexia Data Consortium that will be included in the list of authors for
manuscripts stemming from this project. 
If you are interested in learning more about the study and/or would like
to contribute data, please contact Mark Eckert at dyslexia @ musc.edu
.


Eckert MA, Leonard CM, Wilke M, Eckert M, Richards T, Richards A, & Berninger V (2005). Anatomical signatures of dyslexia in children: unique information from manual and voxel based morphometry brain measures. Cortex; a journal devoted to the study of the nervous system and behavior, 41 (3), 304-15 PMID: 15871596