Showing posts with label H-index. Show all posts

Sunday, October 12, 2014

Some thoughts on use of metrics in university research assessment


The UK’s Research Excellence Framework (REF) is like a walrus: it is huge, cumbersome and has a very long gestation period. Most universities started preparing in earnest for the REF early in 2011, with submissions being made late in 2013. Results will be announced in late December, just in time to cheer up our seasonal festivities.


Like many others, I have moaned about the costs of the REF: not just in money, but also the time spent by university staff, who could be more cheerfully and productively engaged in academic activities. The walrus needs feeding copious amounts of data: research outputs must be carefully selected and then graded in terms of research quality. Over the summer, those dedicated souls who sit on REF panels were required to read and evaluate several hundred papers. Come December, the walrus digestive system will have condensed the concerted ponderings of some of the best academic minds in the UK into a handful of rankings.


But is there a viable alternative? Last week I attended a fascinating workshop on the use of metrics in research. I had earlier submitted comments to an independent review of the role of metrics in research assessment from the Higher Education Funding Council for England (HEFCE), arguing that we need to consider cost-effectiveness when developing assessment methods. The current systems of evaluation have grown ever more complex and expensive, without anyone considering whether the associated improvements justified the increasing costs. My view is that an evaluation system need not be perfect – it just needs to be ‘good enough’ to provide a basis for disbursement of funds that can be seen to be both transparent and fair, and which does not lend itself readily to gaming.


Is there an alternative?

When I started preparing my presentation, I had intended to talk just about the use of measures of citations to rank departments, using analysis done for an earlier blogpost, as well as results from this paper by Mryglod et al. Both sources indicated that, at least in sciences, the ultimate quality-related research (QR) funding allocation for a department was highly correlated with a department-based measure of citations. So I planned to make the case that if we used a citation-based metric (which can be computed by a single person in a few hours) we could achieve much the same result as the full REF process for evaluating outputs, which takes many months and involves hundreds of people.

However, in pondering the data, I then realised that there was an even better predictor of QR funding per department: simply the number of staff entered into the REF process.


Before presenting the analysis, I need to backtrack to just explain the measures I am using, as this can get quite confusing. HEFCE deserves an accolade for its website, where all the relevant data can be found. My analyses were based on the 2008 Research Assessment Exercise (RAE).  In what follows I used a file called QR funding and research volume broken down by institution and subject, which is downloadable here. This contains details of funding for each institution and subject for 2009-2010. I am sure the calculations I present here have been done much better by others and I hope they will not by shy to inform me if there are mistakes in my working.


The variables of interest are:


  • The percentages of research falling in each star band in the RAE. From this, one can compute an average quality rating, by multiplying 4* by 7, 3* by 3, and 2* by 1 and adding these, and dividing the total by 100. Note that this figure is independent of department size and can be treated as an estimate of the average quality of a researcher in that department and subject.

  • The number of full-time equivalent research-active staff entered for the RAE. This is labelled as the ‘model volume number’, but I will call it Nstaff. (In fact, the numbers given in the 2009-2010 spreadsheet are slightly different from those used in the computation, for reasons I am not clear about, but I have used the correct numbers, i.e. those in HEFCE tables from RAE2008).

  • The departmental quality rating: this is average quality rating x Nstaff. (Labelled as “model quality-weighted volume” in the file). This is summed across all departments in a discipline to give a total subject quality rating (labelled as “total quality-weighted volume for whole unit of assessment”).

  • The overall funds available for the subject are listed as “Model total QR quanta for whole unit of assessment (£)”. I have not been able to establish how this number is derived, but I assume it has to do with the size and cost of the subject, and the amount of funding available from government.

  • QR (quality-related) funding is then derived by dividing the departmental quality rating by the total subject quality rating and multiplying by overall funds. This gives the sum of QR money allocated by HEFCE to that department for that year, which in 2009 ranged from just over £2K (Coventry University, Psychology) to over £12 million (UCL, Hospital-based clinical subjects). The total QR allocation in 2009-2010 for all disciplines was just over £1 billion.

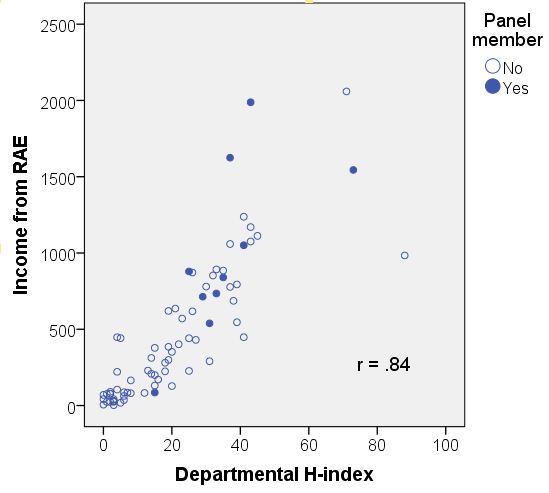
  • The departmental H-index is taken from my previous blogpost. It is derived by doing a Web of Knowledge search for articles from the departmental address, and then computing the H-index in the usual way. Note that this does not involve identifying individual scientists.


Readers who are still with me may have noticed that we'd expect QR funding for a subject to be correlated with Nstaff, because Nstaff features in the formula for computing QR funding. And this makes sense, because departments with more research staff require greater levels of funding. A key question is just how much difference does it make to the QR allocation if one includes the quality ratings from the RAE in the formula.


Size-related funding

To check this out, I computed an alternative metric, size-related funding, which multiplies the overall funds by the proportion of Nstaff in the department relative to total staff in that subject across all departments. So if across all departments in the subject there are 100 staff, a department with 10 staff would get .1 of the overall funds for the subject.


Table 1 shows: the correlation between Nstaff and QR funding (r QR/Nstaff) and how much a department would typically gain or lose if size-related funding were adopted, expressing the absolute difference as a percentage of QR funding (± % diff).


Table 1: Mean number of staff and QR funding by subject, with correlation between QR and N staff, and mean difference between QR funding and size-related funding


Mean Mean r QR/ ± %
Subject Nstaff QR £K Nstaff diff
Cardiovascular Medicine 26.3 794 0.906 23
Cancer Studies 38.1 1,330 0.939 13
Infection and Immunology 43.7 1,506 0.971 22
Other Hospital Based Clinical
Subjects
58.2 1,945 0.986 23
Other Laboratory Based
Clinical Subjects
21.8 685 0.952 41
Epidemiology and Public
Health
26.6 949 0.986 25
Health Services Research 21.9 659 0.900 24
Primary Care & Community
Based Clinical 
10.4 370 0.790 29
Psychiatry, Neuroscience
& Clinical Psychology
46.7 1,402 0.987 15
Dentistry 31.1 1,146 0.977 13
Nursing and Midwifery 18.0 487 0.930 32
Allied Health Professions and
Studies
20.4 424 0.884 36
Pharmacy 27.5 899 0.936 24
Biological Sciences 45.1 1,649 0.978 19
Pre-clinical and Human
Biological Sciences
49.4 1,944 0.887 18
Agriculture, Veterinary and
Food Science
33.2 999 0.976 21
Earth Systems and
Environmental Sciences
28.6 1,128 0.971 14
Chemistry 37.9 1,461 0.969 18
Physics 44.0 1,596 0.994 8
Pure Mathematics 18.4 489 0.957 24
Applied Mathematics 20.0 614 0.988 19
Statistics and Operational
Research
12.6 406 0.953 19
Computer Science and
Informatics
22.9 769 0.954 26
Electrical and Electronic
Engineering
23.8 892 0.982 17
General Engineering;
Mineral/Mining Engineering
28.9 1,073 0.958 30
Chemical Engineering 26.6 1,162 0.968 15
Civil Engineering 23.2 1,005 0.960 19
Mech., Aeronautical,
Manufacturing Engineering
35.7 1,370 0.987 14
Metallurgy and Materials 21.1 807 0.948 24
Architecture and the Built
Environment
18.7 436 0.961 23
Town and Country Planning 15.1 306 0.911 27
Geography and Environmental
Studies
22.8 505 0.969 21
Archaeology 20.7 518 0.990 12
Economics and Econometrics 25.7 581 0.968 20
Accounting and Finance 11.7 156 0.982 19
Business and Management
Studies
38.7 630 0.964 27
Library and Information
Management
16.3 244 0.935 26
Law 26.6 426 0.960 30
Politics and International
Studies
22.4 333 0.955 31
Social Work and Social Policy
& Administration
19.1 324 0.944 26
Sociology 24.1 404 0.933 24
Anthropology 18.6 363 0.946 12
Development Studies 21.7 368 0.936 25
Psychology 21.1 424 0.919 35
Education 21.0 346 0.983 34
Sports-Related Studies 13.5 231 0.952 37
American Studies and
Anglophone Area Studies
10.9 191 0.988 11
Middle Eastern and African
Studies
17.7 393 0.978 17
Asian Studies 15.9 258 0.938 26
European Studies 20.1 253 0.787 30
Russian, Slavonic and East
European Languages
8.7 138 0.973 22
French 12.6 195 0.979 16
German, Dutch and
Scandinavian Languages
8.4 129 0.966 17
Italian 6.3 111 0.865 20
Iberian and Latin American
Languages
9.1 156 0.937 17
Celtic Studies 0.0 328

English Language and
Literature
20.9 374 0.982 26
Linguistics 11.7 168 0.956 18
Classics, Ancient History,
Byzantine and Modern Greek Studies
19.4 364 0.992 22
Philosophy 14.4 258 0.987 23
Theology, Divinity and
Religious Studies
11.4 174 0.958 32
History 20.8 366 0.988 21
Art and Design 22.7 419 0.955 37
History of Art, Architecture
and Design
10.7 213 0.960 18
Drama, Dance and Performing
Arts
9.8 221 0.864 36
Communication, Cultural and
Media Studies
11.9 195 0.860 29
Music 10.6 259 0.863 33


Correlations between Nstaff and QR funding are very high –above .9. Nevertheless, this analysis shows that, as is evident in Table 1, if we substituted size-related funding for QR funding, the amounts gained or lost by individual departments can be substantial.  In some subjects, though, mainly in the Humanities, where overall QR allocations are anyhow quite modest, the difference between size-related and QR funding is not large in absolute terms. In such cases, it might be rational to allocate funds solely by Nstaff and ignore quality ratings.  The advantage would be an enormous saving in time – one could bypass the RAE or REF entirely. This might be a reasonable option if the amount of expenditure on the RAE/REF by the department exceeds any potential gain from inclusion of quality ratings.


Is the departmental H-index useful?

If we assume that the goal is to have a system that approximates the outcomes of the RAE (and I’ll come back to that later) then for most subjects you need something more than Nstaff. The issue then is whether an easily computed department-based metric such as the H-index or total citations could add further predictive power. I looked at the figures for two subjects where I had computed the departmental H-index: Psychology and Physics.  As it happens, Physics is an extreme case: the correlation between Nstaff and QR funding was .994. Adding an H-index does not improve prediction because there is virtually no variance left to explain. As can be seen from Table 1, Physics is a case where use of size-related funding might be justified, given that the difference between size-related and QR funding averages out at only 8%.


For Psychology, adding the H-index to the regression explains a small but significant 6.2% of additional variance, with the correlation increasing to .95.


But how much difference would it make in practice if we were to use these readily available measures to award funding instead of the RAE formula? The answer is more than you might think, and this is because the range in award size is so very large that even a small departure from perfect prediction can translate into a lot of money.


Table 2 shows the different levels of funding that departments would accrue depending on how the funding formula is computed. The full table is too large and complex to show here, so I'll just show every 8th institution. As well as comparing alternative size-related and H-index-based (QRH) metrics with the RAE funding formula (QR0137), I have looked at how things change if the funding formula is tweaked: either to give more linear weighting to the different star categories (QR1234), or to give more extreme reward for the highest 4* category (QR0039) – something which is rumoured to be a preferred method for REF2014. In addition, I have devised a metric that has some parallels with the RAE metric, based on the residual of the H-index after removing effect of departmental size. This could be used as an index of quality that is independent of size;
it correlates with r = .87 with the RAE average quality rating. To get an
alternative QR estimate, it was substituted for the average quality
rating in the funding formula to give the Size.Hres measure.


Table 2: Funding results in £K from different metrics for seven Psychology departments representing different levels of QR funding


institution QR0137 Size-related QR1234 QR0039 QRH Size.Hres
A 1891 1138 1424 2247 1416 1470
B 812 585 683 899 698 655
C 655 702 688 620 578 576
D 405 363 401 400 499 422
E 191 323 276 121 279 304
F 78 192 140 44 299 218
G 26 161 81 13 60 142


To avoid invidious comparisons, I have not labelled the departments, though anyone who is curious about their identity could discover them quite readily.  The two columns that use the H-index tend to give similar results, and are closer to a QR funding based that treats the four star ratings as equal points on a scale (QR1234). It is also apparent that a move to QR0039 (where most reward is given for 4* research and none for 1* or 2*) will increase the share of funds to those institutions who are already doing well, and decrease it for those who already have poorer income under the current system. One can also see that some of the Universities at the lower end of the table – all of them post 1992 universities – seem disadvantaged by the RAE metric, in that the funding they received seems low relative to both their size and the H-index.


The quest for a fair solution

So what is a fair solution? Here, of course, lies the problem. There is no gold standard. There has been a lot of discussion about whether we should use metrics, but much less discussion of what we are hoping to achieve with a funding allocation.


How about the idea that we could allocate funds simply on the basis of the number of research-active staff? In a straw poll I’ve taken, two concerns are paramount.


First, there is a widely held view that we should give maximum rewards to those with highest quality research, because this will help them maintain their high standing, and incentivise others to do well. This is coupled with a view that we should not be rewarding those who don’t perform. But how extreme do we want this concentration of funding to be? I’ve expressed concerns before that too much concentration in a few elite institutions is not good for UK academia, and that we should be thinking about helping middle-ranking institution become elite, rather than focusing all our attention on those who have already achieved that status. The calculations from RAE in Table 2 show how a tweaking of the funding formula to give higher weighting to 4* research will take money from the poorer institutions and give it to the richer ones: it would be good to see some discussion of the rationale for this approach.


The second source of worry is the potential for gaming. What is to stop a department from entering all their staff, or boosting numbers by taking on extra staff? The first point could be dealt with by having objective criteria for inclusion, such as some minimal number of first- or last-authored publications in the reporting period.  The second strategy would be a risky one, since the institution would have to provide salaries and facilities for the additional staff, and this would only be cost-effective if the QR allocation would cover it. Of course, a really cynical gaming strategy would be to hire people briefly for the REF and then fire them once it is over. However, if funding were simply a function of number of research-active staff, it would be easy to do an assessment annually, to deter such short-term strategies.


How about the departmental H-index? I have shown that it not only is a fairly good predictor of RAE QR funding outcomes on its own, incorporating as it does both aspects of departmental size and research quality, but it also correlates with the RAE measure of quality, once the effect of departmental size is adjusted for. This is all the more impressive when one notes that the departmental H-index is based on any articles listed as coming from the departmental address, whereas the quality rating is based just on those articles submitted to the RAE.


There are well-rehearsed objections to the use of citation metrics such as the H-index: first any citation-based measure is useless for very recent articles. Second, citations vary from discipline to discipline, and in my own subject, Psychology, within sub-disciplines.. Furthermore, the H-index can be gamed to some extent by self-citation, or scientific cliques, and one way of boosting it is to insist on having your name on any publication you are remotely connected with - though the latter strategy is more likely to work for the H-index of the individual than for the H-index of the department. It is easy to find anecdotal instances of poor articles that are highly cited and good articles that are neglected.  Nevertheless, it may be a ‘good enough’ measure when used in aggregate: not to judge individuals but to gauge the scientific influence of work coming from a given department over a period of a few years.


The quest for a perfect measure of quality

I doubt that either of these ‘quick and dirty’ indices will be adopted for future funding allocations, because it’s clear that most academics hate the idea of anything so simple. One message frequently voiced at the Sussex meeting was that quality is far too complex to be reduced to a single number.  While I agree with that sentiment, I am concerned that in our attempts to get a perfect assessment method, we are developing systems that are ever more complex and time-consuming. The initial rationale for the RAE was that we needed a fair and transparent means of allocating funding after the 1992 shake-up of the system created many new universities. Over the years, there has been mission creep, and the purpose of the RAE has been taken over by the idea that we can and should measure quality, feeding an obsession with league tables and competition. My quest for something simpler is not because I think quality is simple, but rather because I think we should use the REF just as a means to allocate funds. If that is our goal, we should not reject simple metrics just because we find them oversimplistic: we should base our decisions on evidence and go for whatever achieves an acceptable outcome at reasonable cost. If a citation-based metric can do that job, then we should consider using it unless we can demonstrate that something else works better.


I'd be very grateful for comments and corrections.


Reference
 

Mryglod, O., Kenna, R., Holovatch, Y., & Berche, B. (2013). Comparison of a citation-based indicator and peer review for absolute and specific measures of research-group excellence Scientometrics, 97 (3), 767-777 DOI: 10.1007/s11192-013-1058-9

Saturday, January 26, 2013

An alternative to REF2014?


After blogging last week about use of journal impact factors in REF2014, many people have asked me what alternative I'd recommend. Clearly, we need a transparent, fair and cost-effective method for distributing funding to universities to support research. Those designing the REF have tried hard over the years to devise such a method, and have explored various alternatives, but the current system leaves much to be desired.


Consider the current criteria for rating research outputs, designed by someone with a true flair for ambiguity:


Rating Definition
4* Quality that is world-leading in terms of originality, significance and rigour
3* Quality that is internationally excellent in terms of originality, significance and rigour but which falls short of the highest standards of excellence
2* Quality that is recognised internationally in terms of originality, significance and rigour
1* Quality that is recognised nationally in terms of originality, significance and rigour


Since only 4* and 3* outputs will feature in the funding formula, then a great deal hinges on whether research is deemed “world-leading”, “internationally excellent” or “internationally recognised”. This is hardly transparent or objective. That’s one reason why many institutions want to translate these star ratings into journal impact factors. But substituting a discredited, objective criterion for a subjective criterion is not a solution.


The use of bibliometrics was considered but rejected in the past. My suggestion is that we should reconsider this idea, but in a new version. A few months ago, I blogged about how university rankings in the previous assessment exercise (RAE) related to grant income and citation rates for outputs. Instead of looking at citations for individual researchers, I used Web of Science to compute an H-index for the period 2000-2007 for each department, by using the ‘address’ field to search. As noted in my original post, I did this fairly hastily and the method can get problematic in cases where a Unit of Assessment does not correspond neatly to a single department. The H-index reflected all research outputs of everyone at that address – regardless of whether they were still at the institution or entered for the RAE. Despite these limitations, the resulting H-index predicted the RAE results remarkably well, as seen in the scatterplot below, which shows H-index in relation to the funding level following from RAE. This is computed by number of full-time staff equivalents multiplied by the formula:

    .1 x 2* + .3  x 3* + .7 x 4*

(N.B. I ignored subject weighting, so units are arbitrary).


Psychology (Unit of Assessment 44), RAE2008 outcome by H-index

Yes, you might say, but the prediction is less successful at the top end of the scale, and this could mean that the RAE panels incorporated factors that aren’t readily measured by such a crude score as H-index. Possibly true, but how do we know those factors are fair and objective? In this dataset, one variable that accounted for additional variance in outcome, over and above departmental H-index, was whether the department had a representative on the psychology panel: if they did, then the trend was for the department to have a higher ranking than that predicted from the H-index. With panel membership included in the regression, the correlation (r) increased significantly from .84 to .86, t = 2.82, p = .006. It makes sense that if you are a member of a panel, you will be much more clued up than other people about how the whole process works, and you can use this information to ensure your department’s submission is strategically optimal. I should stress that this was a small effect, and I did not see it in a handful of other disciplines that I looked at, so it could be a fluke. Nevertheless, with the best intentions in the world, the current system can’t ever defend completely against such biases.


So overall, my conclusion is that we might be better off using a bibliometric measure such as a departmental H-index to rank departments. It is crude and imperfect, and I suspect it would not work for all disciplines – especially those in the humanities. It relies solely on citations, and it's debatable whether that is desirable. But for sciences, it seems to be pretty much measuring whatever the RAE was measuring, and it would seem to be the lesser of various possible evils, with a number of advantages compared to the current system. It is transparent and objective, it would not require departments to decide who they do and don’t enter for the assessment, and most importantly, it wins hands down on cost-effectiveness. If we'd used this method instead of the RAE, a small team of analysts armed with Web of Science should be able to derive the necessary data in a couple of weeks to give outcomes that are virtually identical to those of the RAE.  The money saved both by HEFCE and individual universities could be ploughed back into research. Of course, people will attempt to manipulate whatever criterion is adopted, but this one might be less easily gamed than some others, especially if self-citations from the same institution are excluded.


It will be interesting to see how well this method predicts RAE outcomes in other subjects, and whether it can also predict results from the REF2014, where the newly-introduced “impact statement” is intended to incorporate a new dimension into assessment.

Sunday, July 15, 2012

The devaluation of low-cost psychological research


Psychology encompasses a wide range of subject areas,
including social, clinical and developmental psychology, cognitive psychology
and neuroscience. The costs of doing different types of psychology vary hugely.
If you just want to see how people remember different types of material, for
instance, or test children's understanding of numerosity, this can be done at very
little cost. For most of the psychology I did as an undergraduate, data
collection did not involve complex equipment, and data analysis was pretty
straightforward - certainly well within the capabilities of a modern desktop
computer. The main cost for a research proposal in this area would be for staff
to do data collection and analysis. Neuroscience, however, is a different
matter. Most kinds of brain imaging require not only expensive equipment, but
also a building to house it and staff to maintain it, and all or part of these
costs will be passed on to researchers. Furthermore, data analysis is usually
highly technical and complex, and can take weeks, or even months, rather than
hours. A project that involves neuroimaging will typically cost orders of
magnitude more than other kinds of psychological research.


In academic research, money follows money. This is quite
explicit in funding systems that reward an institution in proportion to their
research income. This makes sense: an institution that is doing costly research
needs funding to support the infrastructure for that research. The problem is
that the money, rather than the research, can become the indicator of success. Hiring
committees will scrutinise CVs for evidence of ability to bring in large
grants. My guess is that, if choosing between one candidate with strong
publications and modest grant income vs. another with less influential
publications and large grant income, many would favour the latter.
Universities, after all, have to survive in a tough financial climate, and so
we are all exhorted to go after large grants to help shore up our institution's
income. Some Universities have even taken to firing people who don't bring in
the expected income. This means that cheap cost-effective research in
traditional psychological areas will be devalued relative to more expensive
neuroimaging.


I have no quarrel, in principle, with psychologists doing
neuroimaging studies - some of my best friends are neuroimagers -  and it is important that if good science is to be done in
this area that it should be properly funded. I am uneasy, though, about an
unintended consequence of the enthusiasm for neuroimaging, which is that it has
led to a devaluation of the other kinds of psychological research. I've been
reading Thinking Fast and Slow,
by Daniel Kahneman, a psychologist who has the rare distinction of
being a Nobel Laureate. This is just one example of a psychologist who has made major advances without using brain scanners. I couldn't help thinking that Kahneman would not fare
well in the current academic climate, because his experiments were simple,
elegant ... and inexpensive.


I've suggested previously that systems of academic rewards
need to be rejigged to take into account not just research income and
publication outputs, but the relationship between the two. Of course, some
kinds of research require big bucks, but large-scale grants are not always
cost-effective. And on the other side of the coin, there are people who do
excellent, influential work on a small budget.


I thought I'd see if it might be possible to get some hard
data on how this works in practice. I used data for Psychology Departments from
the last Research Assessment Exercise (RAE), from this website, and matched
this up against citation counts for publications that came out in the same time
period (2000-2007) from Web of Knowledge. The latter is a bit tricky, and I'm
aware that figures may contain inaccuracies, as I had to search by address,
using the name of the institution coupled with the words Psychology and UK. This will miss articles that don't have these words in the address. Also when double-checking the numbers, I  found that for a search by address, results can fluctuate from one occasion to the next. For these reasons, I'd urge readers to treat the results with caution, and
I won't refer to institutions by name. Note too that though I restrict consideration to articles between 2000-2007, the citations extend
beyond the period when the RAE was completed. Web of Knowledge helpfully gives
you an H-index for the institution if you ask for a citation report, and this
is what I report here, as it is more stable across repeated searches than the citation count. Figure 1 shows how research income for a department
relates to its H-index, just for those institutions deemed research active,
which I defined as having a research income of at least £500K over the reporting
period. The overall RAE rating is colour-coded into bandings, and the symbol denotes
whether or not the departmental submission mentions neuroimaging as an
important part of its work. 


Data from RAE and Web of Knowledge: treat with caution!


Several features are seen in these data, and most are
unsurprising:


  • Research income and H-index are positively correlated, r =
    .74 (95%CI .59-.84) as we would expect. Both variables are correlated with the
    number of staff entered in the RAE, but the correlation between them remains
    healthy when this factor is partialled out, r = .61 (95%CI .40-.76).

  • Institutions coded as doing neuroimaging have bigger grants: after taking into account differences in number of staff, the mean income
    for departments with neuroimaging was £7,428K and for those without it was
    £3,889K (difference significant at p = .01).

  • Both research income and H-index are predictive of RAE
    rankings: the correlations are .68 (95% CI .50-.80) for research income and .79
    (95% CI .66-.87) for H-index, and together they account for 80% of the variance
    in rankings. We would not expect perfect prediction, given that the RAE committee
    went beyond metrics to assess aspects of research quality not
    reflected in citations or income. And in addition, it must be noted that the
    citations counted here are for all researchers at a departmental address, not
    just those entered in the RAE.


A point of concern to me in these data, though, is the wide
spread in H-index seen for those institutions with the highest levels of grant
income. If these numbers are accurate, some departments are using their
substantial income to do influential work, while others seem to achieve no more
than other departments with much less funding. There may be reasonable
explanations for this - for instance, a large tranche of funding may have been
awarded in the RAE period but not had time to percolate through to
publications. But nevertheless, it adds to my concern that we may
be rewarding those who chase big grants without paying sufficient attention to
what they do with the funding when they get it.


What, if anything, should we do about this? I've toyed in
the past with the idea of a cost-efficiency metric (e.g. citations divided by
grant income), but this would not work as a basis for allocating funds, because
some types of research are intrinsically more expensive than others. In
addition, it is difficult to get research funding, and success in this arena is
in itself an indicator that the researchers have impressed a tough committee of
their peers. So, yes, it makes sense to treat level of research funding as one indicator
of an institution's research excellence when rating departments to determine
who gets funding. My argument is simply that we should be aware of the
unintended consequences if we rely too heavily on this metric. It would be nice
to see some kind of indicator of cost-effectiveness included in ratings of
departments alongside the more traditional metrics. In times of financial
stringency, it is particularly short-sighted to discount the contribution of
researchers who are able to do influential work with relatively scant
resources.