Saturday, January 26, 2013

An alternative to REF2014?


After blogging last week about use of journal impact factors in REF2014, many people have asked me what alternative I'd recommend. Clearly, we need a transparent, fair and cost-effective method for distributing funding to universities to support research. Those designing the REF have tried hard over the years to devise such a method, and have explored various alternatives, but the current system leaves much to be desired.


Consider the current criteria for rating research outputs, designed by someone with a true flair for ambiguity:


Rating Definition
4* Quality that is world-leading in terms of originality, significance and rigour
3* Quality that is internationally excellent in terms of originality, significance and rigour but which falls short of the highest standards of excellence
2* Quality that is recognised internationally in terms of originality, significance and rigour
1* Quality that is recognised nationally in terms of originality, significance and rigour


Since only 4* and 3* outputs will feature in the funding formula, then a great deal hinges on whether research is deemed “world-leading”, “internationally excellent” or “internationally recognised”. This is hardly transparent or objective. That’s one reason why many institutions want to translate these star ratings into journal impact factors. But substituting a discredited, objective criterion for a subjective criterion is not a solution.


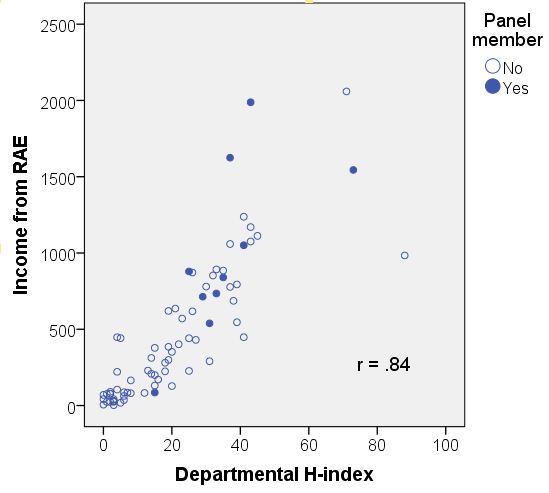
The use of bibliometrics was considered but rejected in the past. My suggestion is that we should reconsider this idea, but in a new version. A few months ago, I blogged about how university rankings in the previous assessment exercise (RAE) related to grant income and citation rates for outputs. Instead of looking at citations for individual researchers, I used Web of Science to compute an H-index for the period 2000-2007 for each department, by using the ‘address’ field to search. As noted in my original post, I did this fairly hastily and the method can get problematic in cases where a Unit of Assessment does not correspond neatly to a single department. The H-index reflected all research outputs of everyone at that address – regardless of whether they were still at the institution or entered for the RAE. Despite these limitations, the resulting H-index predicted the RAE results remarkably well, as seen in the scatterplot below, which shows H-index in relation to the funding level following from RAE. This is computed by number of full-time staff equivalents multiplied by the formula:

    .1 x 2* + .3  x 3* + .7 x 4*

(N.B. I ignored subject weighting, so units are arbitrary).


Psychology (Unit of Assessment 44), RAE2008 outcome by H-index

Yes, you might say, but the prediction is less successful at the top end of the scale, and this could mean that the RAE panels incorporated factors that aren’t readily measured by such a crude score as H-index. Possibly true, but how do we know those factors are fair and objective? In this dataset, one variable that accounted for additional variance in outcome, over and above departmental H-index, was whether the department had a representative on the psychology panel: if they did, then the trend was for the department to have a higher ranking than that predicted from the H-index. With panel membership included in the regression, the correlation (r) increased significantly from .84 to .86, t = 2.82, p = .006. It makes sense that if you are a member of a panel, you will be much more clued up than other people about how the whole process works, and you can use this information to ensure your department’s submission is strategically optimal. I should stress that this was a small effect, and I did not see it in a handful of other disciplines that I looked at, so it could be a fluke. Nevertheless, with the best intentions in the world, the current system can’t ever defend completely against such biases.


So overall, my conclusion is that we might be better off using a bibliometric measure such as a departmental H-index to rank departments. It is crude and imperfect, and I suspect it would not work for all disciplines – especially those in the humanities. It relies solely on citations, and it's debatable whether that is desirable. But for sciences, it seems to be pretty much measuring whatever the RAE was measuring, and it would seem to be the lesser of various possible evils, with a number of advantages compared to the current system. It is transparent and objective, it would not require departments to decide who they do and don’t enter for the assessment, and most importantly, it wins hands down on cost-effectiveness. If we'd used this method instead of the RAE, a small team of analysts armed with Web of Science should be able to derive the necessary data in a couple of weeks to give outcomes that are virtually identical to those of the RAE.  The money saved both by HEFCE and individual universities could be ploughed back into research. Of course, people will attempt to manipulate whatever criterion is adopted, but this one might be less easily gamed than some others, especially if self-citations from the same institution are excluded.


It will be interesting to see how well this method predicts RAE outcomes in other subjects, and whether it can also predict results from the REF2014, where the newly-introduced “impact statement” is intended to incorporate a new dimension into assessment.

Saturday, January 19, 2013

Journal Impact Factors and REF 2014


In 2014, British institutions of Higher Education are to be evaluated in the Research Excellence Framework (REF), an important exercise on which their future funding depends. Academics are currently undergoing scrutiny by their institutions to determine whether their research outputs are good enough to be entered in the REF. Outputs are to be assessed in terms of  "‘originality, significance and rigour’, with reference to international research quality standards."

Here's what the REF2014 guidelines say about journal impact factors:


"No sub-panel will make any use of journal impact factors, rankings, lists or the perceived standing of publishers in assessing the quality of research outputs."


Here are a few sources that explain why it is a bad idea to use impact factors to evaluate individual research outputs:

Stephen Curry's blog

David Colquhoun letter to Nature

Manuscript by Brembs & Munafo on "Unintended consequences of journal rank"

Editage tutorial


Here is some evidence that the REF2014 statement on impact factors is being widely ignored:


Jenny Rohn Guardian blogpost


And here's a letter I wrote yesterday to the representatives of RCUK who act as observers on REF panels about this. I'll let you know if I get a reply.


18th January 2013


To: Ms Anne-Marie Coriat: Medical Research Council   
Dr Alf Game: Biotechnology and Biological Sciences Research Council   
Dr Alison Wall: Engineering and Physical Sciences Research Council   
Ms Michelle Wickendon: Natural Environment Research Council   
Ms Victoria Wright: Science and Technology Facilities Council   
Dr Fiona Armstrong: The Economic and Social Research Council    
Mr Gary Grubb: Arts and Humanities Research Council    


Dear REF2014 Observers,

I am contacting you because a growing number of academics are expressing concerns that, contrary to what is stated in the REF guidelines, journal impact factors are being used by some Universities to rate research outputs. Jennifer Rohn raised this issue here in a piece on the Guardian website last November:
http://www.guardian.co.uk/science/occams-corner/2012/nov/30/1


I have not been able to find any official route whereby such concerns can be raised, and I have evidence that some of those involved in the REF, including senior university figures and REF panel members, regard it as inevitable and appropriate that journal impact factors will be factored in to ratings - albeit as just one factor among others. Many, perhaps most, of the academics involved in panels and REF preparations grew up in a climate where publication in a high impact journal was regarded as the acme of achievement. Insofar as there are problems with the use of impact factors, they seem to think the only difficulty is the lack of comparability across sub-disciplines, which can be adjusted for. Indeed, I have been told that it is naïve to imagine that this statement should be taken literally: "No sub-panel will make any use of journal impact factors, rankings, lists or the perceived standing of publishers in assessing the quality of research outputs." 


Institutions seem to vary in how strictly they are interpreting this statement and this could lead to serious problems further down the line. An institution that played by the rules and submitted papers based only on perceived scientific quality might challenge the REF outcome if they found the panel had been basing ratings on journal impact factor. The evidence for such behaviour could be reconstructed from an analysis of outputs submitted for the REF.


I think it is vital that RCUK responds to the concerns raised by Dr Rohn to clarify the position on journal impact factors and explain the reasoning behind the guidelines on this. Although the statement seems unambiguous, there is a widespread view that the intention is only to avoid slavish use of impact factors as a sole criterion, not to ban their use altogether. If that is the case, then this needs to be made explicit. If not, then it would be helpful to have some mechanism whereby academics could report institutions that flout this rule.

Yours sincerely

(Professor) Dorothy Bishop


Reference

Colquhoun, D. (2003). Challenging the tyranny of impact factors Nature, 423 (6939), 479-479 DOI: 10.1038/423479a


P.S. 21/1/13

This post has provoked some excellent debate in the Comments, and also on Twitter. I have collated the tweets on Storify here, and the Comments are below. They confirm that there are very divergent views out there about whether REF panels are likely to, or should, use journal impact factor in any shape or form. They also indicate that this issue is engendering high levels of anxiety in many sections of academia.


P.P.S. 30/1/13

REPLY FROM HEFCE


I now have a response from Graeme Rosenberg, REF Manager at HEFCE, who kindly agreed that I could post relevant content from his email here. This briefly explains why impact factors are disallowed for REF panels, but notes that institutions are free to flout this rule in their submissions, at their own risk. The text follows:


I think your letter raises two sets of issues, which I will respond to in turn. 


The REF panel criteria state clearly that panels will not use journal impact factors in the assessment. These criteria were developed by the panels themselves and we have no reason to doubt they will be applied correctly. The four main panels will oversee the work of the sub-panels throughout the assessment process, and it part of the main panels' remit to ensure that all sub-panels apply the published criteria. If there happen to be some individual panel members at this stage who are unsure about the potential use of impact factors in the panels' assessments, the issue will be clarified by the panel chairs when the assessment starts. The published criteria are very clear and do not leave any room for ambiguity on this point. 


The question of institutions using journal impact factors in preparing their submissions is a separate issue. We have stated clearly what the panels will and will not be using to inform their judgements. But institutions are autonomous and ultimately it is their decision as to what forms of evidence they use to inform their selection decisions. If they choose to use journal impact factors as part of the evidence, then the evidence for their decisions will differ to that used by panels. This would no doubt increase the risk to the institution of reaching different conclusions to the REF panels. Institutions would also do well to consider why the REF panels will not use journal impact factors - at the level of individual outputs they are a poor proxy for quality. Nevertheless, it remains the institution's choice.


Friday, January 11, 2013

Genetic variation and neuroimaging: some ground rules for reporting research


Those who follow me on Twitter may have
noticed signs of tetchiness in my tweets over the past few weeks. In the course
of writing a review article, I’ve been reading papers linking genetic variants
to language-related brain structure and function. This has gone more slowly than I expected for
two reasons. First, the literature gets ever more complicated and technical:
both genetics and brain imaging involve huge amounts of data, and new methods
for crunching the numbers are developed all the time. If you really want to understand
a paper, rather than just assuming the Abstract is accurate, it can be a long,
hard slog, especially if, like me, you are neither a geneticist nor a
neuroimager. That’s understandable and perhaps unavoidable. The other reason,
though, is less acceptable. For all their complicated methods, many of the
papers in this area fail to tell the reader some important and quite basic
information. This is where the tetchiness comes in. Having burned my brains out
trying to understand what was done, I then realise that I have no idea about
something quite basic like the sample size. The initial assumption is that I’ve
missed it, and so I wade through the paper again, and the Supplementary Material, looking
for the key information. Only when I’m absolutely certain that it’s not there,
am I reduced to writing to the authors for the information. So
this is a plea – to authors, editors and reviewers. If a paper is concerned
with an association between a genetic variant and a phenotype (in my case the
interest is in neural phenotypes, but I suspect this applies more widely) then
could we please ensure that the following information is clearly reported in
the Methods or Results section


1. What genetic variant are we talking about?
You might think this is very simple, but it’s not: for instance, one of the
genes I’m interested in is CNTNAP2, which has been associated with a range of
neurodevelopmental disorders, especially those affecting language. The evidence
for a link between CNTNAP2 and developmental disorders comes from studies that
have examined variation in single-nucleotide polymorphisms or SNPs. These are
segments of DNA that are useful in revealing differences between people because
they are highly variable. DNA is composed of four bases, C, T, G, and A in
paired strands. So for instance, we might have a locus where some people have
two copies of C, some have two copies of T, and others have a C and a T. SNPs
are not  necessarily a functional part of
the gene itself – they may be in a non-coding region, or so close to a gene that
variation in the SNP co-occurs with variation in the gene. Many different SNPs
can index the same gene. So for CNTNAP2, Vernes et al (2008)tested 38 SNPs,
ten of which were linked to language problems. So we have to decide which SNP
to study – or whether to study all of them. And we have to decide how to do the
analysis. For instance, SNP rs2710102 can take the form CC, CT or TT. We could
look for a dose response effect (CC < CT < TT) or we could compare CC/CT with TT, or we could compare CC with CT/TT. Which of these we do may depend on whether prior research suggests the genetic effect is additive or dominant, but for brain imaging studies grouping can also be dictated by practical considerations: it’s usual to compare just two groups and to combine genotypes to give a reasonable sample size. If you’ve followed me so far, and you have some background in statistics, you will already be starting to see why this is potentially problematic. If the researcher can select from ten possible SNPs, and two possible analyses, the opportunities for finding spuriously ‘significant’ results are increased. If there are no directional predictions – i.e. we are just looking for a difference between two groups, but don’t have a clear idea of what type of difference will be associated with ‘risk’ – then the number of potentially ‘interesting’ results is doubled.


For CNTNAP2, I found two papers that had
looked at brain correlates of SNP rs2710102. Whalley et al (2011) found that adults
with the CC genotype had different patterns of brain activation from CT/TT
individuals. However, the other study, by Scott-van Zeeland et al (2010), treated
CC/CT as a risk genotype that was compared with TT. (This was not clear in the
paper, but the authors confirmed it was what they did).


 Four studies looked at another SNP -
rs7794745, on the basis that an increased risk of autism had been reported for
the T allele in males. Two of them (Tan et al, 2010; Whalley et al, 2010) compared TT vs TA/AA and two (Folia et al, 2011; Kos et al, 2012) compared
TT/TA with AA. In any case, the ground is rather cut from under the feet of
these researchers by a recent failure to replicate an association of this SNP
with autism (Anney et al, 2012).


2. Who are the participants? It’s not very
informative to just say you studied “healthy volunteers”. There are some types
of study where it doesn’t much matter how you recruited people. A study looking
at genetic correlates of cognitive ability isn’t one of them. Samples of
university students, for instance, are not representative of the general
population, and aren’t likely to include many people with significant language
problems.


3. How many people in the study had each type
of genetic variant?
And if subgroup analyses are reported, how many people in
each subgroup had each type of genetic variant? I've found that papers in top-notch journals often fail to provide this basic
information.


Why is this important? For a start, likelihood
of showing significant activation of a brain region will be affected by sample
size. Suppose you have 24 people with genotype A and 8 with genotype B. You
find significant activation of brain region X in those with genotype A, but not
for those with genotype B. If you don’t do an explicit statistical comparison
of groups (you should - but many people don’t) you may be misled into concluding that brain
activation is defective in genotype B – when in fact you just have low power to
detect effects in that group because it is so small.


In addition, if you don’t report the N, then
it’s difficult to get an idea of the effect size and confidence interval for
any effect that is reported. The reasons why this is optimal are
well-articulated here. This issue has been much discussed in psychology, but seems not to have
permeated the field of genetics, where reliance on p-values seems the norm. In
neuroimaging it gets particularly complicated, because some form of correction
for ‘false discovery’ will be applied when multiple comparisons are conducted. It’s
often hard to work out quite how this was done, and you can end up staring at
a table that shows brain regions and p-values, with only a vague idea of how
big a difference there actually is between groups.


 Most of the SNPs that are being used in brain studies are ones that
were found to be associated with a behavioural phenotype in large-scale genomic
studies where the sample size would include hundreds if not thousands of
individuals, so small effects could be detected. Brain-based studies often use
sample sizes that are relatively small, but some of them find large, sometimes
very large, effects. So what does that mean? The optimistic interpretation is
that a brain-based phenotype is much closer to the gene effect, and so gives
clearer findings. This is essentially 
the argument used by those who talk of ‘endophenotypes’ or ‘biomarkers’.
There is, however, an alternative, and much more pessimistic view, which is
that studies linking genotypes with brain measures are prone to generate false
positive findings, because there are too many places in the analysis pipeline
where the researchers have opportunities to pick and choose the analysis that
brings out the effect of interest most clearly. Neuroskeptic has a nice blogpost illustrating this well-known problem in
the neuroimaging area; matters are only made worse by uncertainty re SNP classification
(point 1).


A source of concern here is the
unpublishability of null findings. Suppose you did a study where you looked at,
say, 40 SNPs and a range of measures of brain structure, covering the whole
brain. After doing appropriate corrections for multiple comparisons, nothing is
significant. The sad fact is that your study is unlikely to find a home in a
journal. But is this right? After all, we don’t want to clutter up the
literature with a load of negative results. The answer depends on your sample
size, among other things. In a small sample, a null result might well reflect
lack of statistical power to detect a small effect. This is precisely why
people should avoid doing small studies: if you find nothing, it’s
uninterpretable. What we need are studies that allow us to say with confidence
whether or not there is a significant gene effect.


4. How do the genetic/neuroimaging results relate to cognitive measures in your sample?  Your notion that ‘underactivation of brain area
X’ is an endophenotype that leads to poor language, for instance, doesn’t look
very plausible if people who have such underactivation have excellent language skills. Out
of five papers on CNTNAP2 that I reviewed, three made no mention of cognitive measures,
one gathered cognitive data but did not report how it related to genotype or
brain measures, and only one provided some relevant, though sketchy, data.


5. Report negative findings. The other kind of
email I’ve been writing to people is one that says – could you please clarify
whether your failure to report on the relationship between X and Y was because
you didn’t do that analysis, or whether you did the analysis but failed to find
anything. This is going to be an uphill battle, because editors and reviewers
often advise authors to remove analyses with nonsignificant findings. This is a
very bad idea as it distorts the literature.


And last of all....


A final plea is not so much to journal
editors as to press officers. Please be aware that studies of common SNPs aren't the same as studies of rare genetic mutations. The genetic variants in the
studies I looked at were all relatively common in the general population, and so
aren't going to be associated with major brain abnormalities. Sensationalised
press releases can only cause confusion:


This release on the Scott van-Zeeland (2010) study described neuroimaging
findings from  CNTNAP2 variants that are found in over 70% of the population. It claims that:


  • “A gene variant tied to autism rewires the
    brain"


  • "Now we can begin to unravel the mystery
    of how genes rearrange the brain's circuitry, not only in autism but in many
    related neurological disorders."


  • “Regardless of their diagnosis, the children
    carrying the risk variant showed a disjointed brain. The frontal lobe was
    over-connected to itself and poorly connected to the rest of the brain”


  • "If we determine that the CNTNAP2
    variant is a consistent predictor of language difficulties, we could begin to
    design targeted therapies to help rebalance the brain and move it toward a path
    of more normal development."


Only at the end of the press release, are we
told that "One third of the population [sic: should be two thirds] carries this variant in its DNA.
It's important to remember that the gene variant alone doesn't cause autism, it
just increases risk." 


References


Anney, R., Klei, L.,
Pinto, D., Almeida, J., Bacchelli, E., Baird, G., . . . Devlin, B. .
Individual common variants exert weak effects on the risk for autism spectrum
disorders. Human Molecular Genetics, 21(21), 4781-4792. doi: 10.1093/hmg/dds301(2012)

V. Folia, C. Forkstam, M.
Ingvar, P. Hagoort, K. M. Petersson, Implicit artificial syntax processing:
Genes, preference, and bounded recursion. Biolinguistics 5,  (2011).


M. Kos et al., CNTNAP2
and language processing in healthy individuals as measured with ERPs. PLOS One
7,  (2012).

Scott-Van Zeeland, A., Abrahams, B., Alvarez-Retuerto, A., Sonnenblick, L., Rudie, J., Ghahremani, D., Mumford, J., Poldrack, R., Dapretto, M., Geschwind, D., & Bookheimer, S. (2010). Altered Functional Connectivity in Frontal Lobe Circuits Is Associated with Variation in the Autism Risk Gene CNTNAP2 Science Translational Medicine, 2 (56), 56-56 DOI: 10.1126/scitranslmed.3001344


G. C. Tan, T. F. Doke, J.
Ashburner, N. W. Wood, R. S. Frackowiak, Normal variation in fronto-occipital
circuitry and cerebellar structure with an autism-associated polymorphism of
CNTNAP2. Neuroimage 53, 1030 (2010).


Vernes, S. C., Newbury,
D. F., Abrahams, B., Winchester, L., Nicod, J., Groszer, M., . . . Fisher, S.  A functional genetic link between distinct developmental language
disorders. New England Journal of Medicine, 359, 2337-2345. (2008).


H. C. Whalley et al.,
Genetic variation in CNTNAP2 alters brain function during linguistic processing
in healthy individuals. Am. J. Med. Genet. B 156B, 941 (2011).

Saturday, December 22, 2012

Genes, brains and lateralisation: how solid is the evidence?


If there were a dictionary of famous neurological quotes, “Nous parlons avec l'hémisphère gauche” by Paul Broca (1865) would be up there among the top hits. Broca’s realisation that the two sides of the brain are functionally distinct was a landmark observation. It was based on a rather small series of patients, but has since been confirmed in numerous studies. After localised brain injury, aphasia (language impairment) is far more likely after damage to the left side than the right side. And nowadays, we can visualise greater activation of the left side in neurologically intact people as they do language tasks in a brain scanner.


There are many fascinating features of cerebral lateralisation, but I’m going to focus here on just one specific question: what do we know about genetic influences on brain asymmetry in humans?  There are really two questions here: (1) how do genes lead to asymmetric brain development? (2) are there genetic variants that can account for individual variation?  – e.g. the fact that a minority of people have right hemisphere language. I hope to return to question 2 at a later date, but for now, I’ll focus on question 1, because after reading a key paper on this topic, I've struck a whole load of questions that I can’t answer. I’m hoping that some of my genetically-sophisticated readers will be able to help me out.


It’s sometimes stated that cerebral lateralisation is a uniquely human trait, but that’s not true. Nevertheless, we are very different from our primate cousins, insofar as we show a strong population bias to right-handedness, and most people have left-hemisphere language. There are other species which show consistent brain asymmetries, but they are a long way from us on the evolutionary tree. Most of the research I’ve come across is on nematode worms, zebrafish, or songbirds. This is a long way from my comfort zone, but there are some nice reviews that document research on genes influencing asymmetries in these creatures (e.g. here and here). It’s clear, though, that it’s complicated: not just in terms of the range of genes involved, but in the different ways they can generate asymmetry. And there don't seem to be obvious parallels to human brain development.


Despite all this uncertainty, there’s growing evidence that brain asymmetries are present from very early on in life –in newborn babies and even in foetal life. This field is still in its infancy (forgive the pun), and samples of babies are typically too small to reveal reliable relationships between structure and function. Nevertheless, there’s considerable interest in the idea that physical differences between the two sides of the brain may be an indicator of potential for language development.


A particularly exciting topic is genetic determinants of cerebral lateralisation. One study in particular, by Sun et al made a splash when it was published in Science in 2005, since when it has attracted over 140 citations. The authors looked for asymmetric gene expression in post mortem embryonic brains. Their conclusions have been widely cited: “We identified and verified 27 differentially expressed genes, which suggests that human cortical asymmetry is accompanied by early, marked transcriptional asymmetries.” The fact that several different genes were identified was of particular interest to me, because genetic theories by neuropsychologists have typically assumed that just a single gene is responsible for human cerebral lateralisation. I’ve never found a single-gene theory plausible, so I was all too ready to accept evidence that involved multiple genes. But first I wanted to drill down deeper into the methods to find out how the authors reached their conclusions. I’m a psychologist, not a geneticist, and so this was rather challenging. But my deeper reading raised a number of questions.


Sun et al used a method called Serial Analysis of Gene Expression (SAGE) which compares gene expression in different tissues or – as in this case – in corresponding left and right regions of the embryonic brain. The analysis looks for specific sequences of 10 DNA base-pairs, or tags, which index particular genes. SAGE output consists of simple tables, giving the identity of each tag, its count (a measure of cellular gene expression) and an identifier and more detailed description of the corresponding gene. These tables are available for left and right sides for three brain regions (frontal, perisylvian and occipital) for 12- and 14-week old brains, and for perisylvian only for a 19-week-old brain. The perisylvian region is of particular interest because it is the brain region that will develop into the planum temporale, which has been linked with language development.  One brain at each age was used to create the set of SAGE tags.


To identify asymmetrically expressed genes the authors state performed a Monte Carlo test and verified this using the chi square test. I haven’t tracked down the specifics of the Monte Carlo test, which is part of the SAGE software package, but the chi square is pretty straightforward, and involves testing whether the distribution of expression on left and right is significantly different from the distribution of left vs. right expression across all tags in this brain region – which is close to 50%.  In the left-right perisylvian region of a 12-week-old embryonic human brain, there were 49 genes with chi square greater than 6.63 (p < .01): 21 were more highly expressed on the left and 28 more highly expressed on the right.  But for each region the authors considered several thousand tags. So I wondered whether the number of asymmetrically expressed genes was any different from what you’d expect if asymmetry was just arising by chance.


It was possible to check this out from the giant supplementary Excel files that accompany the paper, but this proved far from straightforward.  It turns out that the relationship between tags and genes is not one-to-one.  For around 40% of the tags, there is more than one corresponding gene. It was not clear which gene was selected in such cases, and why. I did find some cases where two genes were assigned to a tag, but my impression was that this was unintentional and in general the authors aimed to avoid double-counting tags. We also have the further problem that some genes are indexed by numerous tags, a point I will return to below.


But let’s just focus first on the individual tags. I compiled a master list of all tags that were expressed in any region at any age, and then made a chart of the frequency of expression in each brain region/age. I excluded any tags where the total expression count on both sides was three or less, as this is too small to show lateralisation, and this left me with 3800 to 4600 tags for analysis in each brain region. I did compute chi square as described by Sun et al, but this is not recommended for small numbers, and so I also evaluated the significance of asymmetry using a two-tailed binomial test. This doesn’t make a huge difference, but is more accurate when comparing small numbers.  Figure 1 shows the proportion of the sample for each brain region where the binomial test gives a p-value of a given size. If the distribution of expression in left and right was purely determined by chance, we’d expect the points to fall on the line. If there were genes for asymmetry we would expect the observed values to fall above the line, especially at low levels of p. It is clear this is not the case. I did cross-check my figures against those of Sun et al, and found they appeared to have missed some cases of significant asymmetry, which meant that in general they found rather fewer cases of significant asymmetry than are shown in Figure 1.


Fig 1. Proportion of tags with "significant" asymmetry, by Age/Brain Region


Sun et al didn’t rely solely on statistical tests of SAGE data to establish asymmetrical expression.  They reported validation studies using a different method for assessing gene expression (real-time PCR). But this used genes selected on the basis of a chi square value of 1.9 or greater (P < .17), which included many where the degree of asymmetry was not large. One goal of PCR analysis was to confirm asymmetric expression levels in the same embryonic brains as the SAGE analysis. Of more interest is whether the findings generalise to new brains. The authors did further cross-validation using real-time PCR with six additional brains of different ages, and reported results for the LMO4 gene, where higher perisylvian expression on the right was evident in two brains at 12 and 14 weeks of age, as well as in the original two brains of the same age. Four other brains, aged 16 to 19 months, did not show asymmetry of expression. Some of the other asymmetrically expressed genes were also tested using real-time PCR in the two other brains, and 27 showed consistent asymmetric expression. It was, however, not clear to me how the significance of asymmetry was assessed in these replication samples.


There is one particular issue I find confusing when I try to evaluate the robustness of the asymmetry results. My expectation was that if a gene was asymmetrically expressed, then this should be evident in all the tags indexing that gene. But Table 1 shows that this isn’t so. For the LMO4 gene, which is the focus of special attention in this paper, there are seven tags that are linked with the gene in at least one brain region: only one of these (in red) shows the rightward asymmetry that is the focus of the paper. Another tag (in blue) shows leftward asymmetry in one sample, and the rest have low levels of expression. Maybe there’s a simple explanation for this – if so I hope that expert geneticists among my readers may be able to comment on this aspect.


Table 1. Left- and right-expression levels for seven tags for the LMO4 gene

I’m aware of two other studies (here and here) that looked for asymmetric gene expression in embryonic human brains but failed to find it . One possible reason for this discrepancy is that these studies focused on later stages of development, rather than the 12-14 week-old period where Sun et al found asymmetry. In addition, power is always low in these studies because of the small number of brains available. As Lambert et al (2011) noted, as well as possible effects of age and gender, there may be individual variation from brain to brain, but typically only one or two samples are available at each age.


So what do I conclude from all of this? I realise for a start that these studies are very hard to do. I also realise we have to make a start somewhere, even if the amount of post mortem material is limited. But I have to say I’m not convinced from the evidence so far that the researchers have demonstrated significant asymmetry of genetic expression in embryonic brains. The methods seem to take insufficient account of the possibility of chance fluctuations in the measurements, and the numbers of asymmetries that have been found don't seem impressive, given the huge number of genes that were investigated. Clearly, something has to be responsible for the physical asymmetries that have been found in foetal and neonatal brains, and the odds seem high that genes are implicated. But is the evidence from Sun et al convincing enough to conclude that we have found some of those genes? I'd love to hear views from readers who have more expertise in this area of research.


P.S. 7th Jan 2013

Thanks to Silvia Paracchini, who drew my attention to further relevant articles:

Johnson, M. B., et al (2009). Functional and evolutionary insights into human brain development through global transcriptome analysis. Neuron, 62(4), 494-509. doi: 10.1016/j.neuron.2009.03.027
This paper looked at a slightly later developmental stage - 18 to 23 weeks gestational age - and did correct for the number of genes considered (False Discovery Rate). They reported striking symmetry of gene expression in the mid-gestational
period, even though structural brain asymmetries have been described at this
stage of development. Note, however, that this is not incompatible with Sun et al, who did not find evidence of asymmetry after 17 weeks gestational age.


Kang, H. J., et al (2011). Spatio-temporal transcriptome of the human brain. Nature, 478(7370), 483-489. 

This is a much larger study, covering the range from 4 weeks gestational age through childhood up to adulthood and old age. This paper does not explicitly report on asymmetry, but they describe genes where the expression varies from brain region to region, or from age to age, after adjustment for False Discovery Rate. I could find no overlap in the list of the genes identified by Sun et al and Kang et al's list of differentially expressed genes.


References 


Abrahams, B. S., Tentler, D., Peredely, J. V., Oldham, M. C., Coppola, G., & Geschwind, D. H. (2007). Genome-wide analyses of human perisylvian cerebral cortical patterning. Proceedings of the National Academy of Sciences, 104, 17849-17854.


Dehaene-Lambertz, G., Hertz-Pannier, L., & Dubois, J. (2006). Nature and nurture in language acquisition: anatomical and functional brain-imaging studies in infants. Trends in Neurosciences, 29, 367-373.


Kivilevitch, Z., Achiron, R., & Zalel, Y. (2010). Fetal brain asymmetry: in utero sonographic study of normal fetuses. American Journal of Obstetrics and Gynecology, 202(4). doi: 359.e1
10.1016/j.ajog.2009.11.001


Lambert, N., Lambot, M.-A., Bilheu, A., Albert, V., Englert, Y., Libert, F., . . . Vanderhaeghen, P. (2011). Genes expressed in specific areas of the human fetal cerebral cortex display distinct patterns of evolution. PLOS One, 6(3), e17753. doi: 10.1371/journal.pone.0017753


Lash, A. E., Tolstoshev, C. M., Wagner, L., Schuler, G. D., Strausberg, R. L., Riggins, G. J., & Altschul, S. F. (2000). SAGEmap: A public gene expression resource. Genome Research, 10(7), 1051-1060. doi: 10.1101/gr.10.7.1051


Sagasti, A. (2007). Three ways to make two sides: Genetic models of asymmetric nervous system development. Neuron, 55(3), 345-351. doi: 10.1016/j.neuron.2007.07.015


Sun T, Patoine C, Abu-Khalil A, Visvader J, Sum E, Cherry TJ, Orkin SH, Geschwind DH, & Walsh CA (2005). Early asymmetry of gene transcription in embryonic human left and right cerebral cortex. Science (New York, N.Y.), 308 (5729), 1794-8 PMID: 15894532


Sun, T., & Walsh, C. A. (2006). Molecular approaches to brain asymmetry and handedness. Nature Reviews Neuroscience, 7, 655-662.
 

Saturday, December 15, 2012

Psychology: Where are all the men?


There's a lot of interest in under-representation of women in certain science subjects, but in psychology, there's more concern about a lack of men. A quick look at figures from UCAS (Universities & Colleges Admissions Service) shows massive differences in gender ratios for different subjects. In figure 1 I’ve plotted the percentage of women accepted for subjects that had at least 6000 successful applicants to degree courses in 2011.


Fig. 1. % Females accepted on popular UK degree courses 2011

Given the large sample sizes, the sex differences are statistically
significant for all subjects except Media Studies, which is bang on 50%.
As a psychologist, I found the most surprising thing about this plot
was the huge preponderance of women in psychology. This didn’t square
with my experiences: my colleagues include a good mix of men and women,
so I was keen to find the explanation for the mismatch. There seemed to be several possible explanations, which aren’t mutually exclusive, namely:


  • Oxford University, where I work, may be biased in favour of men

  • The proportions of women decline with career stage

  • The proportion of women in psychology may have increased since I was a student

  • The proportion of women may vary with sub-area of psychology


So I set off to track down the evidence for these different explanations.


Is Oxford University biased against women?


I’m leading our department’s Athena SWAN panel, whose remit is to identify and remove barriers to women’s progress in scientific careers. In order to obtain an Athena SWAN award, you have to assemble a lot of facts and figures about the proportions of women at different career stages, and so I already had at my fingertips some relevant statistics. (You can find these here). Over the past three years, our student intake ranged from 66% -71% women: rather lower than the UCAS figure of 78%. However, acceptance rates were absolutely equivalent for men and women. The same was true for staff appointments: the likelihood of being accepted for a job did not differ by gender. So with a sigh of relief I think we can exclude this line of explanation.


Does the proportion of women in psychology decline with career stage?


I have a research post and so don’t do much teaching. Have I got a distorted view of the gender ratios because my interactions are mostly with more senior staff? This looks believable from the data on our department. Postgraduate figures ranged from 65%-70% women. Ours is a small department, and so it is difficult to be confident in trends, but in 2011 there were 16/27 (59%) female postdocs, 6/11 (55%) female lecturers, 6/13 (46%) senior researchers and 4/11 (36%) female professors. This trend for the proportion of women to decline as one advances through a career is in line with what has been observed in many other disciplines. We also obtained data from other top-level psychology departments for comparison, and similar trends were seen.


Has the proportion of women in psychology increased over time?


My recollection of my undergraduate days was that male psychology students were plentiful. However, I was an undergraduate in the dark ages of the early 1970s when there were only five Oxford colleges that accepted women, and a corresponding shortage of females in all subjects. So I had a dig around to try to get more data. The UCAS statistics go back only to 1996, and the proportion of women in psychology hasn’t changed: 78% in 1996, 78% in 2011. However, data from the USA show a sharp increase in the proportion of women obtaining psychology doctorates from 1960 (18%) through 1972 (27%) to 1984 (50%). This, of course, is in part a consequence of the increase of women in higher education in general. But that isn’t a total explanation: Figure 2 compares proportions of female PhDs over time in different subject areas, and one can see that psychology shows a particularly pronounced increase compared with other disciplines.


Fig 2. Percentages of PhDs by women in the USA: 1950-1984


Does the proportion of women in psychology vary with sub-area?


The term ‘psychology’ covers a huge range of subject matter with different historical roots. Most areas of academic psychology make some use of statistics, but they vary considerably in how far they require strong quantitative or computational skills. For instance, it would be difficult to specialise in the study of perception or neuroscience without being something of a numbers nerd: that’s generally less true for developmental, clinical, interpersonal or social psychology, which require other skills sets. I looked at data from the American Psychological Association (APA), which publishes the numbers of members and fellows in its different Divisions. The APA is predominantly a professional organisation, and non-applied areas of psychology are not strongly represented in the membership. Nevertheless, one can see clear gender differences, which generally map on to the expectation that women are more focused on the caring professions, and men are more heavily represented in theoretical and quantitative areas. Figure 3 shows relevant data for sections with at least 700 members. It is also worth noting that the graph illustrates the decrease in the proportions of women going from membership to fellowship, a trend bucked by just one Division.


Fig 3. Data from American psychological association: Division membership 2011


What, if anything, should we do?


The big question is how far we should try to manipulate gender differences when we find them. I’ve barely scratched the surface in my own discipline, psychology, yet it’s evident that the reasons for such differences are complex. Figure 2 alone makes it clear that women in Western societies have come a long way in the past half-century: far more of us go to university and do PhDs than was the case fifty years ago. Yet the proportion of women declines as we climb the career ladder. In quantifying this trend, it’s important to compare like with like: those who are in senior positions now are likely to have trained at a time when the gender ratio was different. But it's clear from many surveys that demographics changes can't explain the dearth of women in top jobs: there are numerous reasons why women are more likely than men to leave an academic career – see, for instance, this depressing analysis of reasons why women leave chemistry. In our department we are committed to taking steps to ensure that gender does not disadvantage women who want to pursue an academic career, and I am convinced that with even quite minor changes in culture we can make a difference.


The point I want to stress here, though, is that I see this issue - creating a female-friendly environment for women in psychology-  as separate from the issue of subject preference. I worry that the two issues tend to get conflated in discussions of gender equality. My personal view is that psychology is enriched by having a mix of men and women, and I share the concerns expressed here about difficulties that arise when the subject becomes heavily biased to one gender. However, I am pretty uncomfortable with the idea of trying to steer people’s career choices in order to even out a gender imbalance.


Where this has been tried, my impression is that it's mostly been in the direction of trying to encourage more girls into male-dominated subjects. In effect, the argument is that girl's preferences  are based on wrong information, in that they are unduly influenced by stereotypes. For instance, the Institute of Physics has done a great deal of work on this topic, and they have shown that there are substantial influences of schooling on girls’ subject choices. They concluded that the weak showing of girls in physics can be attributed to lack of inspirational teaching, and a perception among girls that physics is a boys’ subject. They have produced materials to help teachers overcome these influences, and we’ll have to wait and see if this makes any appreciable difference to the proportions of girls taking up the subject (which according to UCAS figures has been pretty stable for 15 years: 19% in 1996 and 18% in 2011).


It's laudable that the Institute of Physics is attempting to improve the teaching of physics in our schools, and to ensure girls do not feel excluded. But if they are right, and gender stereotyping is a major determinant of subject choices, shouldn’t we then adopt similar policies to other subjects that show a gender bias, whether this be in favour of girls or boys?


Interestingly, Marc Smith has produced relevant data in relation to A-level psychology, which is dominated by girls, and perceived by boys as a ‘girly’ subject. So should we try to change that? As Smith notes, the female bias seems linked to a preference for schools to teach A-level psychology options that veer away from more quantitative cognitive topics. Here we find that psychology provides an interesting test case for arguments around gender, because within the subject there are consistent biases for males and females to prefer one kind of sub-area to another. This implies that to alter the gender balance you might need to change what is taught, rather than how it is taught, by giving more prominence to the biological and cognitive aspects of psychology. If true, it might be easier to alter gender ratios in psychology than in physics, but only by modifying the content of the syllabus.


One of the IOP's recommendations is: "Co-ed schools should have a target to
exceed the current national average of 20% of physics A-level students
being girls." But surely this presumes an agenda whereby we aim for
equality of genders in all subjects, with equivalent campaigns to
recruit more boys into nursing, psychology and English? I'm not saying
this would necessarily be a bad thing, but I wonder at the automatic assumption that it has to be a good thing - or even an achievable thing. There are obvious disadvantages of gender imbalances in any subject area - they simply reinforce stereotypes, while at the same time creating challenges at university and in the workplace for those rare individuals who buck the trend and take a
gender-atypical subject. But the kinds of targets set by the IOP make me uneasy nonetheless. The downside of an insistence on gender balance is a sense of coercion, whereby children are made to feel that their choice of subject isn't a real choice, but is only made because they  have been brainwashed by gender stereotypes. Yes, let's do our best to teach boys and girls in an inspiring and gender-neutral fashion, but, as the example of psychology demonstrates, we are still likely to find that females and males tend to prefer different kinds of subject matter.


References
 

Smith, M (2011). Failing boys, failing psychology The Psychologist, 24 (5), 390-391 Other: WOS:000290745000037


Howard, A., & et al, . (1986). The changing face of American psychology: A report from the Committee on Employment and Human Resources. American Psychologist, 41 (12), 1311-1327 DOI: 10.1037//0003-066X.41.12.1311